Monero Analysis – seems like the end of a bearish correction

Next altcoin of the day is Monero, which for the last time, was mentioned by us on the 18th of April. The price was cancelling the major sell signal (after the breakout of the down trendline) and was coming back inside of the triangle. For us, that was a clear sign, that the sentiment turns into a bullish one:
“Yes, the buy signal is being created as we speak, the price is already back inside the triangle. As for now, Monero is up 16%. If the buyers will manage to end the day inside of the triangle, that will create a long-term buy signal, based on the false breakout pattern seen in the beginning of April. “

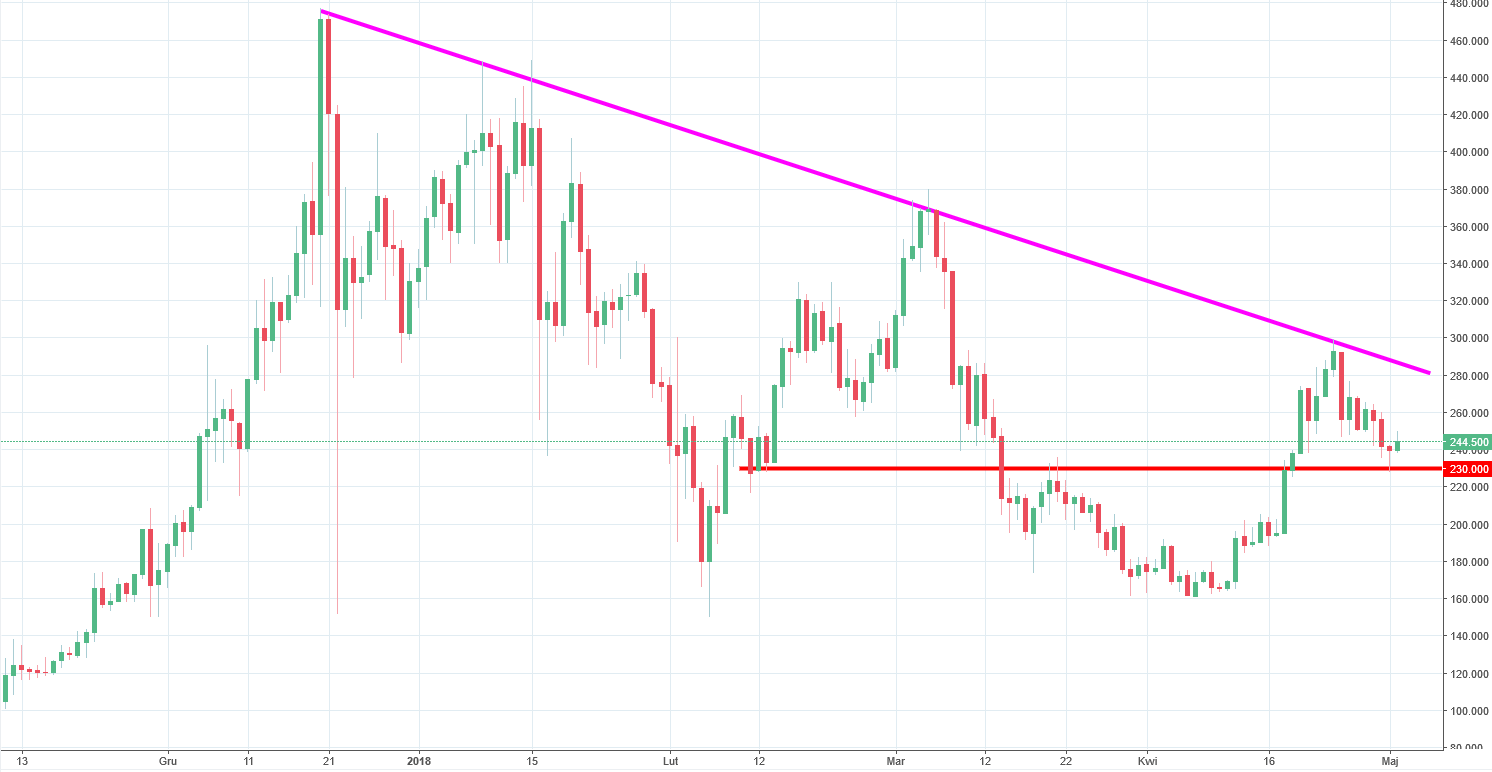
When those words were written and published on this website, the XMR costed around 224 USD. After that, the price went significantly higher and on the 24th of April touched the 299 USD. This is the place, where traders decided to take some profits from the recent movement and the Monero entered the correction phase. Situation here is similar as this on the Dash. Correction is controlled by the buyers and does not look dangerous. Actually, the candle from yesterday, points at the option that the correction has ended and we should come back to rises. Why? The daily candle from Tuesday is shaped like a hammer and touches the support on the 230USD.
Before entering to the long trade with the both feet, remember that we are still under the long-term down trendline (pink). Only the breakout of that resistance should trigger us a legitimate, sustainable buy signal.


Comments (0 comment(s))