NEM Analysis – iH&S underway
June 5th, that was the last time, when we were talking about the NEM. Probably, you are not surprised, that back in that day, we were bearish. The price was around 0.25 USD and in the previous piece, we described the future in the following way:
“Today, we see a small rise but the overall situation here stays negative. The bearish scenario is on, as long as we stay below the blue line. Chances for a bullish breakout are now close to zero and, in the mid-term, the price should continue to decline. „
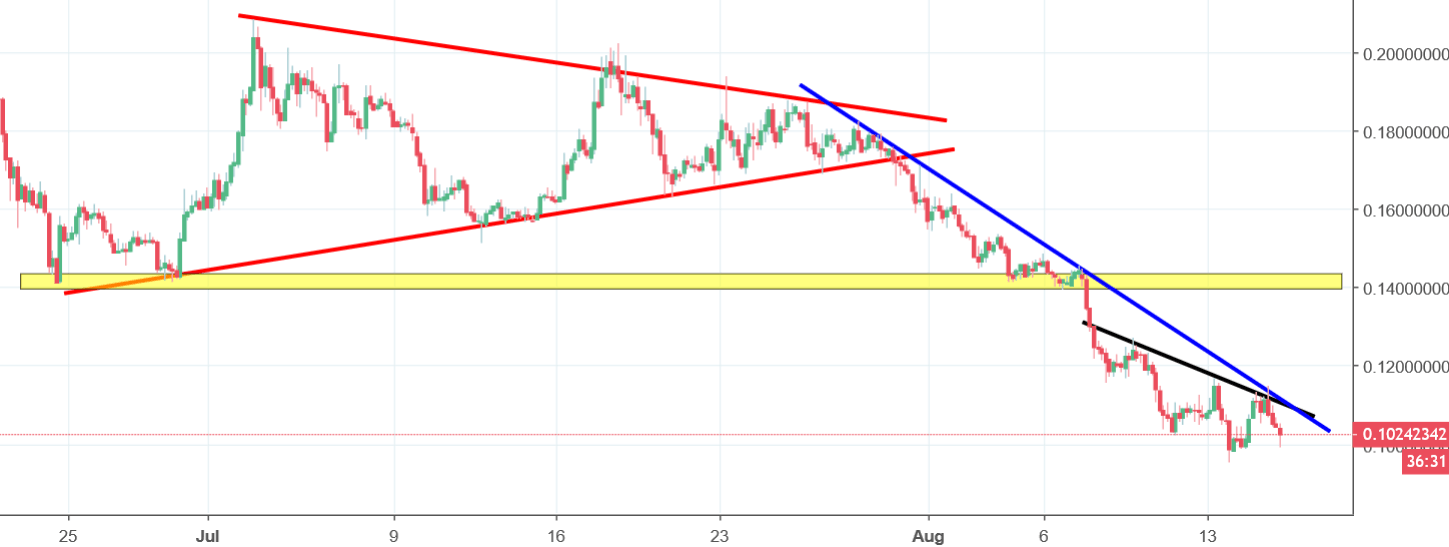
Currently, NEM costs 0.1 USD, so you can see that it was a great call. Since the last time, the situation did not change much. Most recently, the price was in a symmetric triangle formation (red lines), which ended with a bearish breakout. After the breakout, the price went lower, supported by the blue down trendline. In the last few days, XEM created an inverse head and shoulders formation, which can be a start of a nice bullish reversal. The formation is not active yet and for the proper buy signal, you need to wait for the breakout of the neckline (black). Unfortunately for the buyers, this scenario is less likely to happen.


Comments (0 comment(s))