NEO Analysis – Short-term buy

First piece of the day, will be written about the NEO, which was not analysed by us for quite some time – since the 24th of April. Back in that time, the situation was positive and NEO was approaching a long-term down trendline (pink). That is what we wrote back then:
“81 is not only one obstacle here. We are getting closer to the down trendline, which is another bearish factor. Breakout here can be very positive and can be perceived as a super strong buy signal but for that we need to see the daily candle closing above the pink line. „
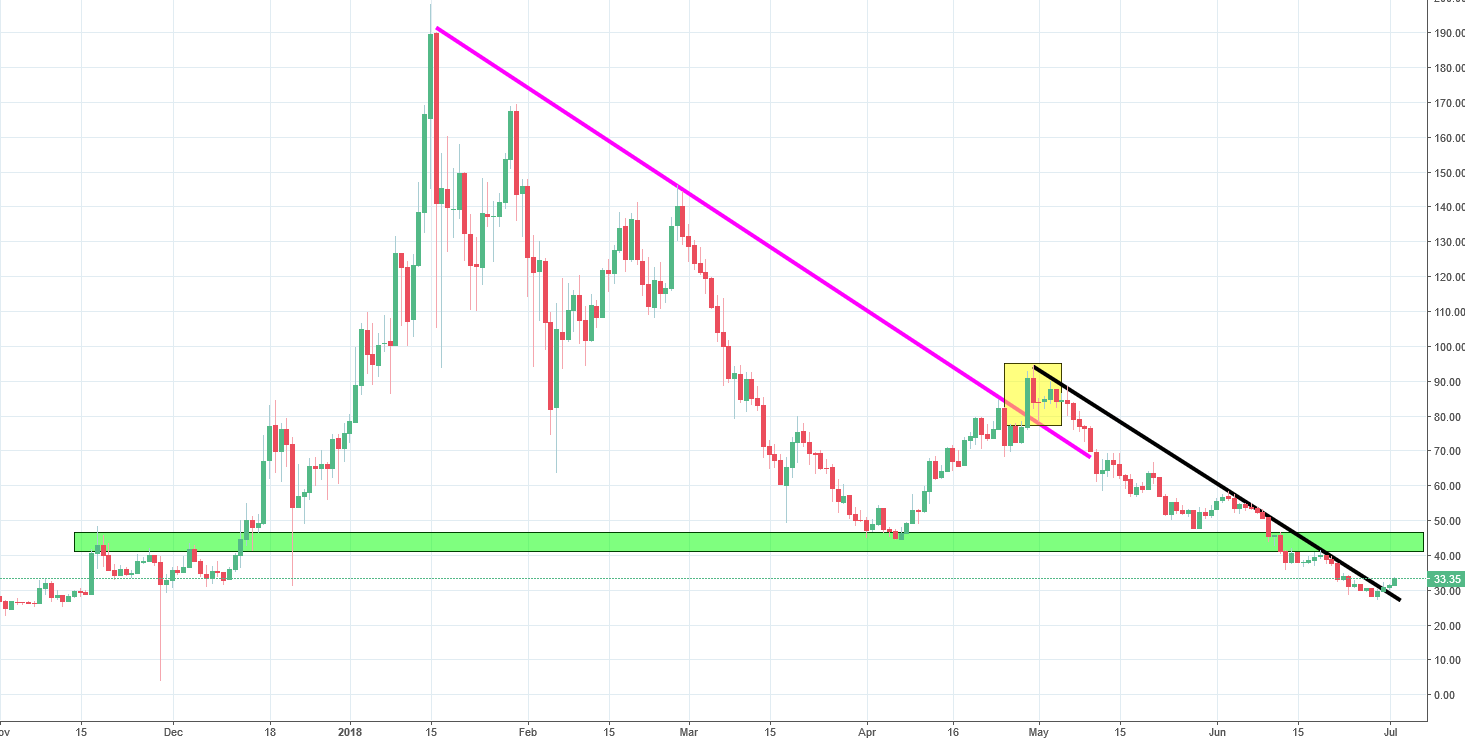
What happened is that the price broke the down trendline and in theory, created a strong buy signal. The thing is that it was a false breakout (yellow rectangle). Instead of climbing higher, the price reversed. False breakouts are nothing new, this pattern is quite common, especially on the Forex Market and can be a great trading opportunity itself. Once the false breakout will be established, all you should do is to open the trade in the opposite direction. That approach is not totally bulletproof but most of the time, really works.
Now, NEO is in a deep downtrend but most recently we do have few positive signals, actually one – the price broke the mid-term down trendline (black) and is today is going around 7% higher. The target for this movement is the green resistance around the 45 USD. The long-term sentiment remains negative but we see chances for a short-term bullish correction.


Comments (0 comment(s))