OmiseGo Analysis – Descending triangle is still here

Last piece today will be about the OmiseGo. Previously, we mentioned this coin on the 7th of June and we were bearish:
“Actually, price getting there will be a good selling opportunity. We already tested this line on the 3rd of June and the second test, with a bearish price action, would be a marvellous occasion to go short. „
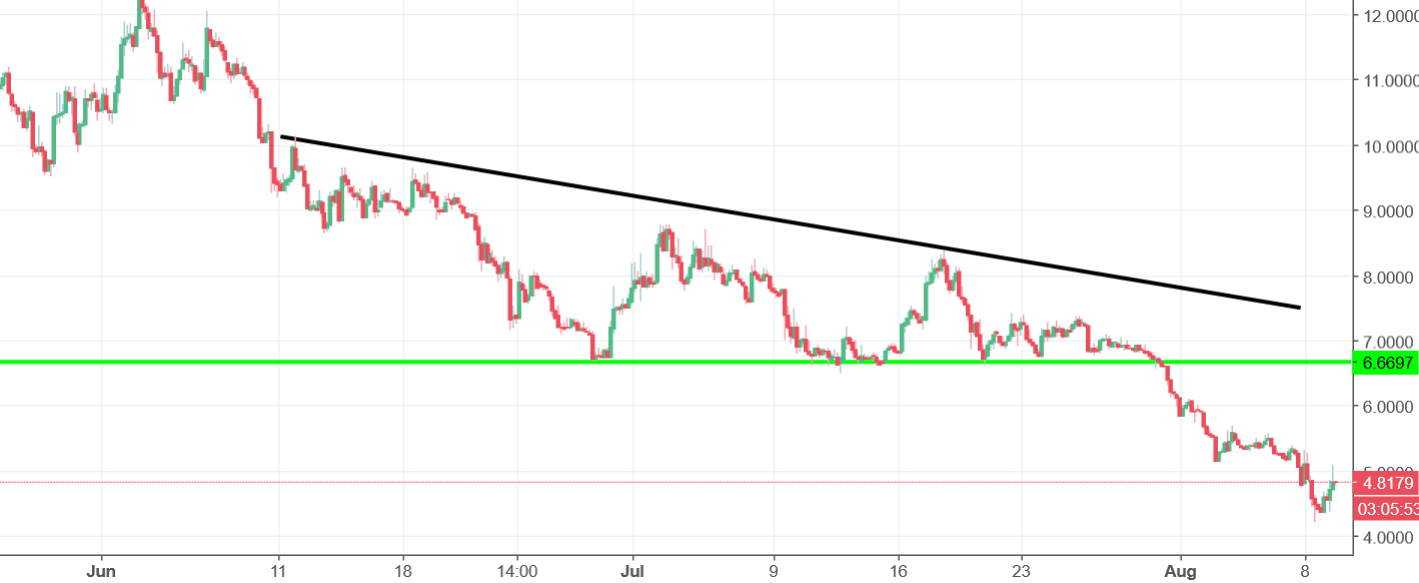
That call was absolutely marvellous. Since those words were written, the price was only going down. We fell from the 12 USD seen back then to the 4,3 seen yesterday. In the meantime, the price created the descending triangle pattern (yellow horizontal support and black dynamic resistance). That is a bearish pattern so there is not surprise that it resulted with a stronger drop.
Today we are up 9% but it does not change anything. Situation is similar to this one seen on the other two coins analysed today. Sell signal is on and we need to climb much higher to cancel it.


Comments (0 comment(s))