Ontology Analysis – What will happen on the 3 USD?
Last piece of the day, will be about the Ontology, previously mentioned by us on the 6th of July, so only few days ago. We were very bearish and we expected prices much lower than those seen back in that day – 4,6 USD. As always, our view was based on the technical situation:
“Quick look at the chart and we can see that the price defended the 5.5 USD as a resistance and created a trend continuation pattern just beneath the red line. That pattern is a pennant (orange lines) and is obviously promoting a further drop. In this case, it is not a surprise that yesterday, the price broke the lower line of this formation and went south. “
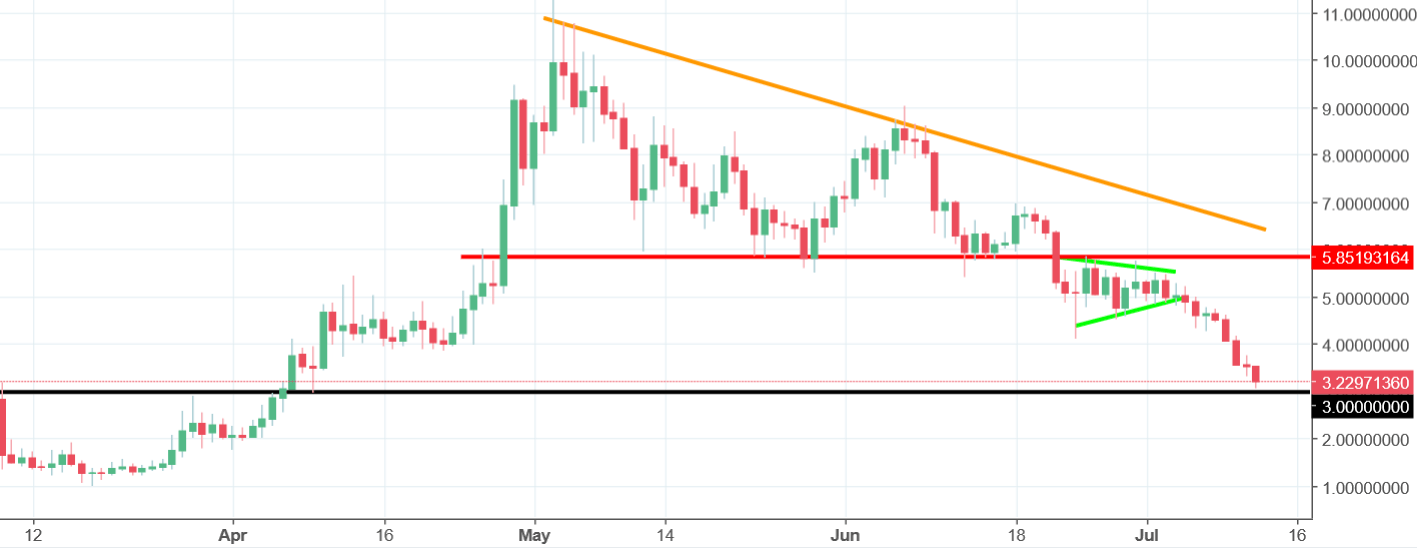
That was a great call. After the breakout of the lower line of the pennant, the price went down. Since that, all days, apart from one, were bearish. In few days, the price lost more than 40%, indeed a great sell signal.
Now, ONT reached a good horizontal support on the psychological barrier of 3 USD (black). This line was previously relevant as a resistance on the 9th and 28th of March. That can be a good occasion for a positive reversal but do not take that for granted. Before going long, it would be nice to see a bullish reversal pattern first.


Comments (0 comment(s))