PIVX Analysis – Eagle has landed

The last analysis of the day, will be done about the PIVX, which for the last time, was analysed on the 26th of May. The price was between two supports and resistances and in theory chances were equal. That was just illusion though and we pointed that out in our piece, writing this:
“When You look on the supports and resistances, we are below 2 and above two, so the chances looks equal. That is just an illusion as the pressure on the supports rises and we are very close to break them all. The last two supports are: the dynamic up trendline and the horizontal one on the 2.5 USD (green). Chances that we will go below are currently very high and that is our scenario for the nearest future. „
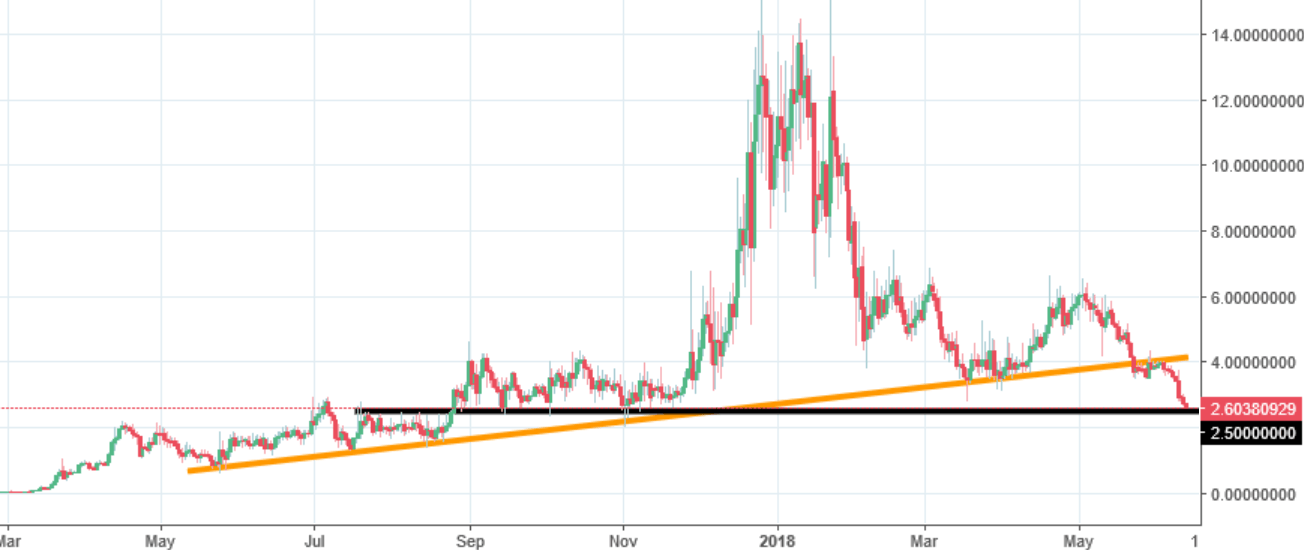
Back then, the price was around 3.8 USD, in the title of the last analysis, we said that the target is on the 2,5 USD. Guess what is the daily low today? Yes, as for now, 2,54 USD. It took us slightly more than two weeks to get there. What is significant here, is that since our previous piece was written, the price was mostly going lower, almost every day.
What will happen now?
Most probably, we should see the breakout and the further drop but it all depends from the price action on the current support. Any bullish formation like an engulfing or a hammer will deny the sell signal and will bring a ray of hope for the demand. Current situation is for the patient price action traders. Can You wait with them for the proper signal?


Comments (0 comment(s))