Qash Analysis – No Santa rally here either

Another instrument, which did not enjoy recent optimism on Bitcoin is Qash. Previously, this crypto was mentioned by us on the 7th of September, when the price was below the crucial horizontal resistance and after two bearish price patterns. We said that it is a bad time for buying and this instrument is poised for a further drop:
“On the chart, we can see a clear resistance – 0.25 USD (orange). The price bounced from that level. Technical analysis principles are telling us, that as long as we stay below the orange line, the sentiment is negative and we should see a further decline. „
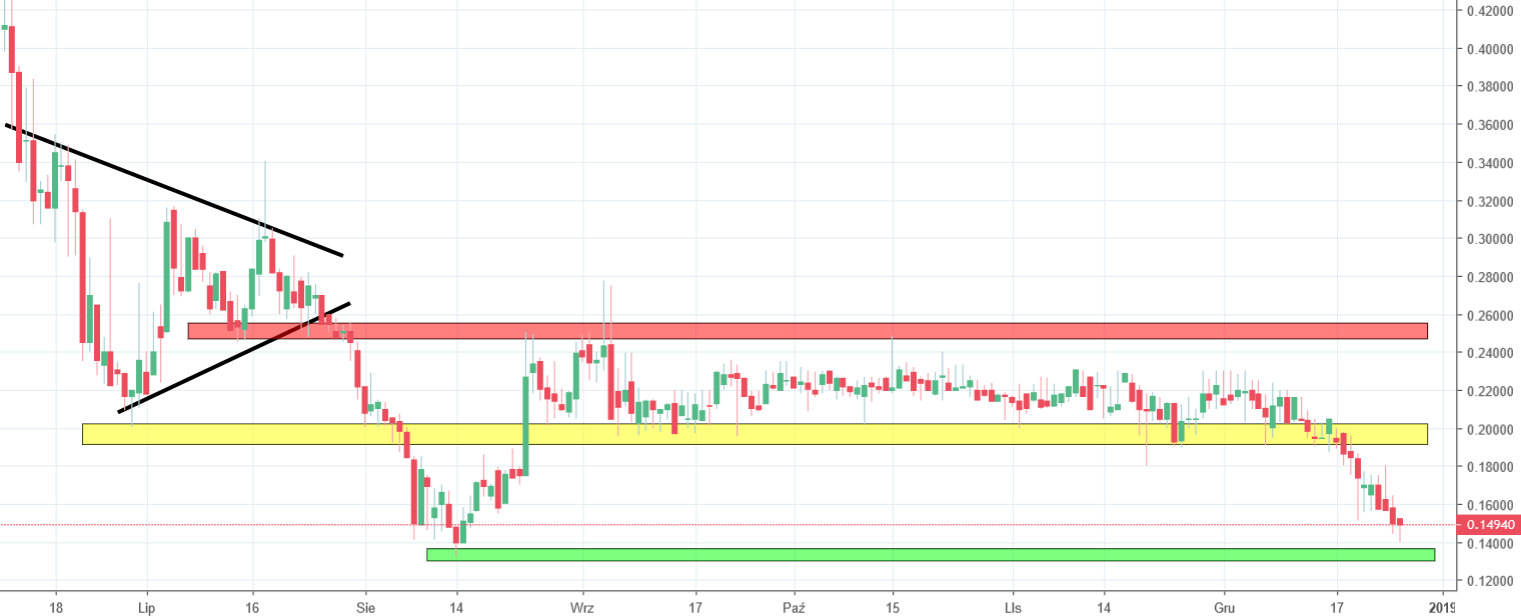
Let’s see how did this work out. Qash, since the end of August till the middle of December was locked in a very tight range between the 0.25 and 0.2 USD. Trading in that time was pretty boring but the most important part is that the price did not breach the resistance that we mentioned in the previous piece. On the 15th of December, the price broke the lower line of the range and went down triggering a sell signal. Currently, we are aiming the green area around 0.13 USD, which are the lows from the 13th of August. We are almost there so probably many buyers are waiting for an occasion to make few bucks. We do not recommend this approach as for now, we do not have any buy signal whatsoever. The whole situation looks negative and the qash should decline further.


Comments (0 comment(s))