Ripple Analysis – Bounce from the 0.55 USD kills the demand

Now, time for Ripple. Long time, no see, you can say. For the last time, we mentioned XRP on the 7th of May, when the price was inside of the rectangle pattern. That is a place, where you do not trade but you patiently wait for the breakout. Luckily, as a trader, you do not care, what side the price will go. As a trader, you just need to trade the movement. In our previous piece, we said:
„What trader has to do now is to wait. The breakout (the price closing a day) above the upper line of the rectangle, will be strong buy signal. The breakout below the lower line of this pattern will do the opposite – trigger the sell signal..”
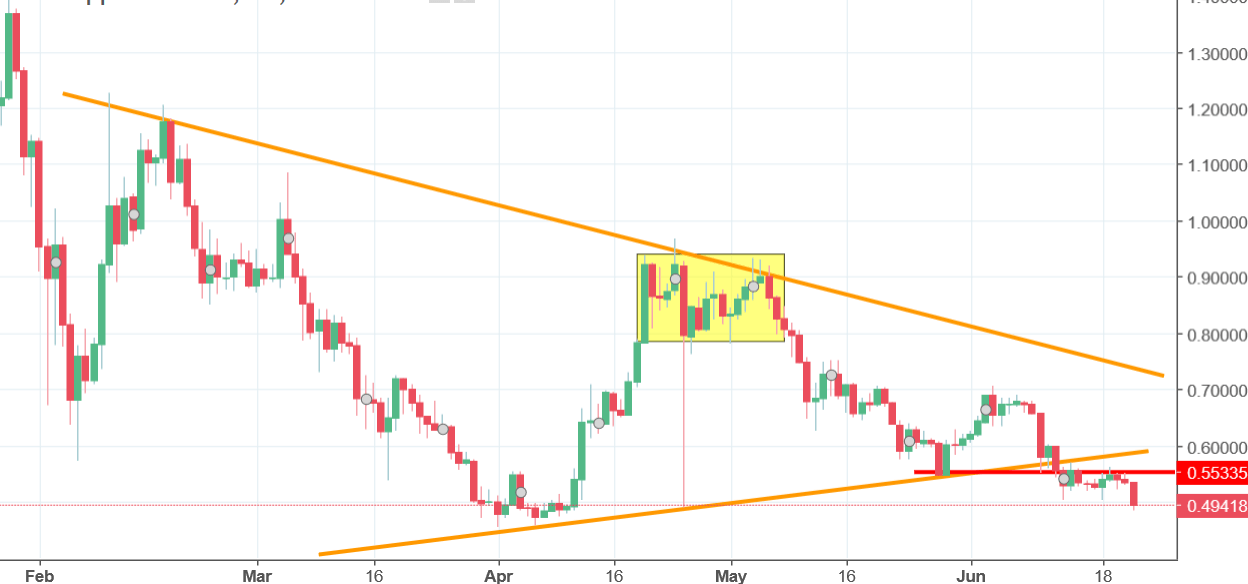
Ripple decided to go down. Decision to sell at that time was great as the price entered a heavy downtrend. On the 11th of June, the price broke the lower line of the triangle, which triggered another sell signal. After that, we broke the 0.55 support and used that as a resistance. On Friday, the price is down over 8%. That is just a simple outcome of all those bearish technical factors mentioned above. Negative sentiment will be denied, when the price will come back above the lower line of the triangle but that is very unlikely at the moment.


Comments (0 comment(s))