Ripple Analysis (XRP) – Sidewys trend is coming to an end

Time to refresh the situation on the Ripple. This altcoin was a guest in our analysis on the 26th of April. We were at the beginning of the sideways trend and we were waiting for the breakout. We still did not get that but the situation developed nicely as the sideways trend is getting bigger and very pleasant from the technical point of view.
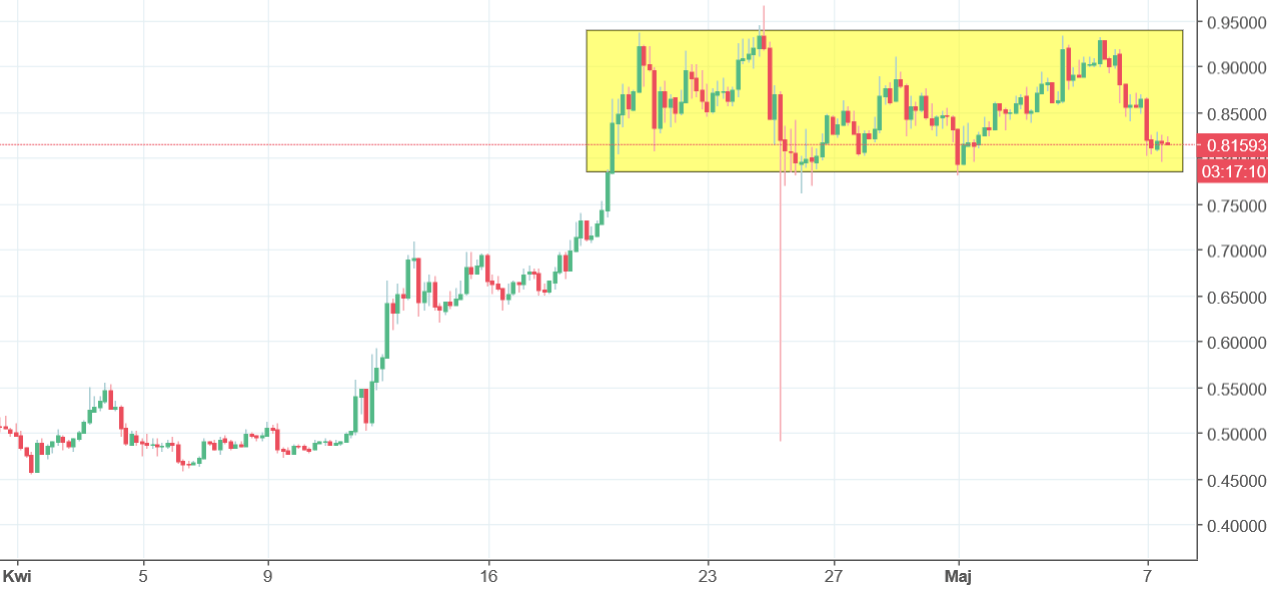
As you can see on the chart, the price is locked inside of the rectangle pattern (yellow). The price is using the 0.78 USD as a support and 0.93 USD as a resistance. Although sideways trends are the worst moments to trade, they give a good occasions for the future.
What trader has to do now is to wait. The breakout (the price closing a day) above the upper line of the rectangle, will be strong buy signal. The breakout below the lower line of this pattern will do the opposite – trigger the sell signal.
Currently it is hard to tell which side will win. Luckily for You, traders do not have to know that. All You need is to react once the breakout will happen. As long as we are inside, all you can do is to wait with your hands ready for action.


Comments (0 comment(s))