SiaCoin Analysis – 0.018 USD almost checked, what is next?

Second piece of the day will be about the SiaCoin. The last analysis for this crypto was done on the 30th of May, when the price was around the 0.015 USD. We saw a mid-term bullish potential there and we were anticipating that the upswing should gain some traction. In the same time, we stayed pessimistic about the overall sentiment towards this coin:
“Sentiment stays negative even after the last two days, which are bullish. As for now, this is just a short-term correction, which is aiming the 0.018 USD to test it as a closest resistance. Price action tells us that this level should be defended and the price should continue to decline. „
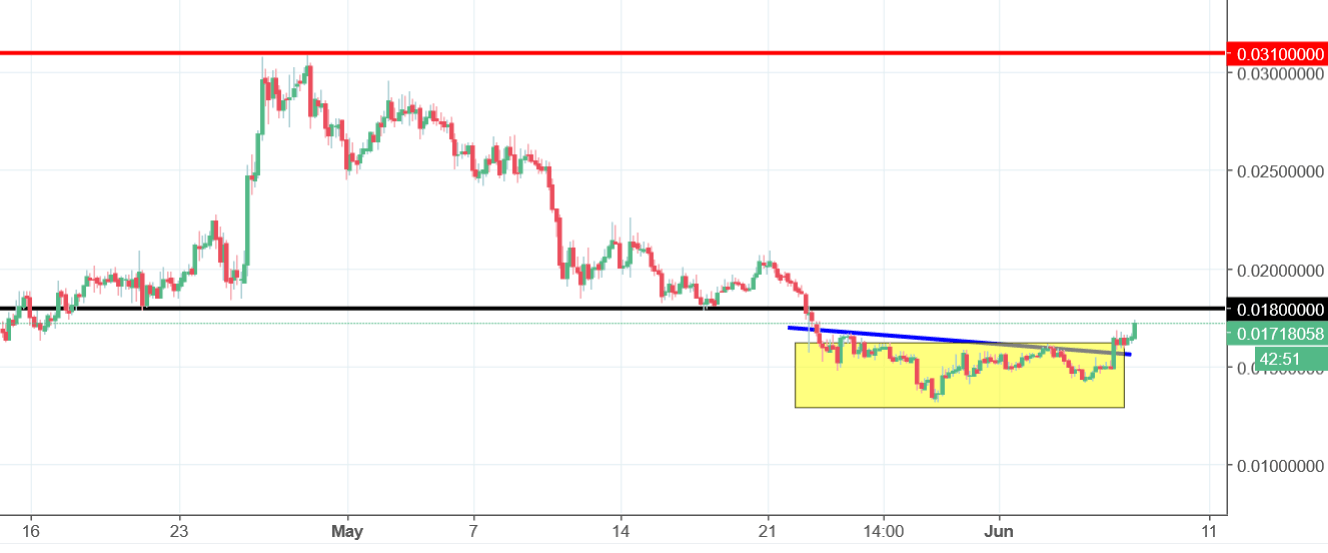
The last few days proved that we were right. The price managed to create the inverse head and shoulders pattern (yellow rectangle), which increased the bullish potential and gave fuel for the correction. The last two days are the best here. The price broke the neckline and is now few steps from the resistance labelled by us in our last analysis.
As price action traders, to make the next step, we need to wait for the price to touch the 0.018 USD. We need to wait for the traders reaction there. The daily candlestick closing above that resistance, will give us a buy signal and the price bouncing from that resistance will give us a sell signal.


Comments (0 comment(s))