SiaCoin Analysis – testing 0.018 USD as a resistance
The second piece of the day, will be written about the SiaCoin, which for the last time, was analysed by us on the 10th of May. Back then, the situation was not so bad and the technical analysis was giving us some optimism. In our piece, we wrote:
“As for now, the most probable scenario is the bounce from the green line and the breakout of the upper pink, which should lead us towards the resistance on the 0.031 USD. It looks like that resistance should be broken relatively soon.”
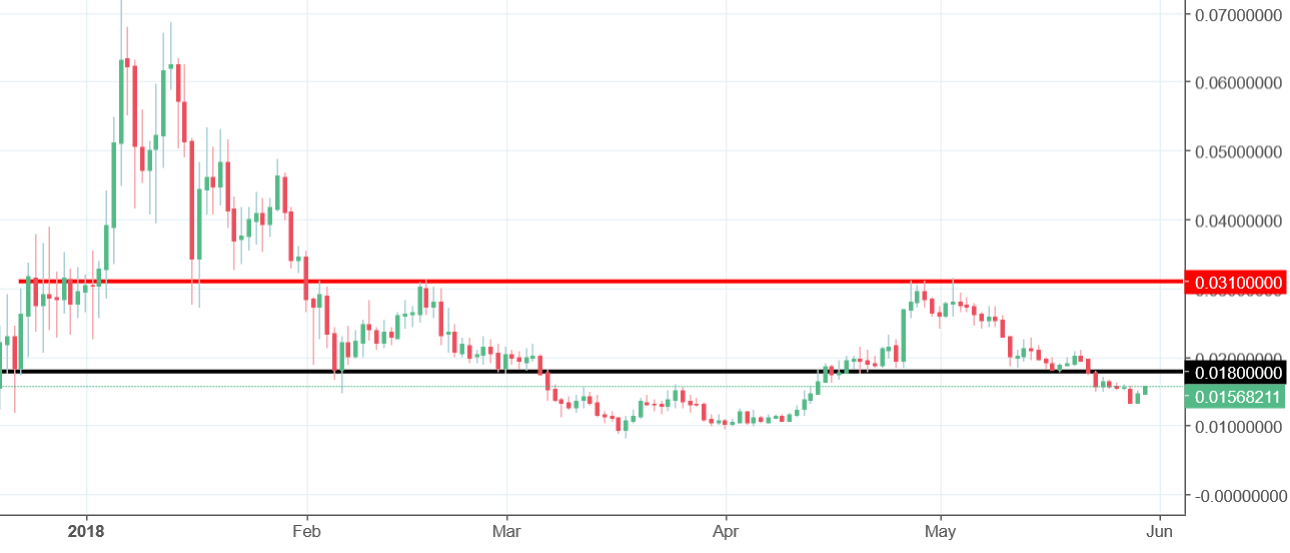
Instead of breaking the resistances, SiaCoin broke the two supports (mid-term up trendline and the lower line of the correction pattern) and went significantly lower aiming the third one – 0.018 USD (black). 0.018 USD defended bravely for few days but was eventually broken on the 23rd of May. From the technical point of view, this opens us a way towards the new long-term lows and that is the current outlook on this coin.
Sentiment stays negative even after the last two days, which are bullish. As for now, this is just a short-term correction, which is aiming the 0.018 USD to test it as a closest resistance. Price action tells us that this level should be defended and the price should continue to decline.


Comments (0 comment(s))