SiaCoin Analysis – On the way to zero

Second piece of the day will the about the Siacoin. It is not the first time that we write about this crypto. We already mentioned it on the 7th of June. We were under the influence of the inverse head and shoulders formation and we were right about the short-term upswing aiming the horizontal resistance:
“As price action traders, to make the next step, we need to wait for the price to touch the 0.018 USD. We need to wait for the traders reaction there. The daily candlestick closing above that resistance, will give us a buy signal and the price bouncing from that resistance will give us a sell signal. „
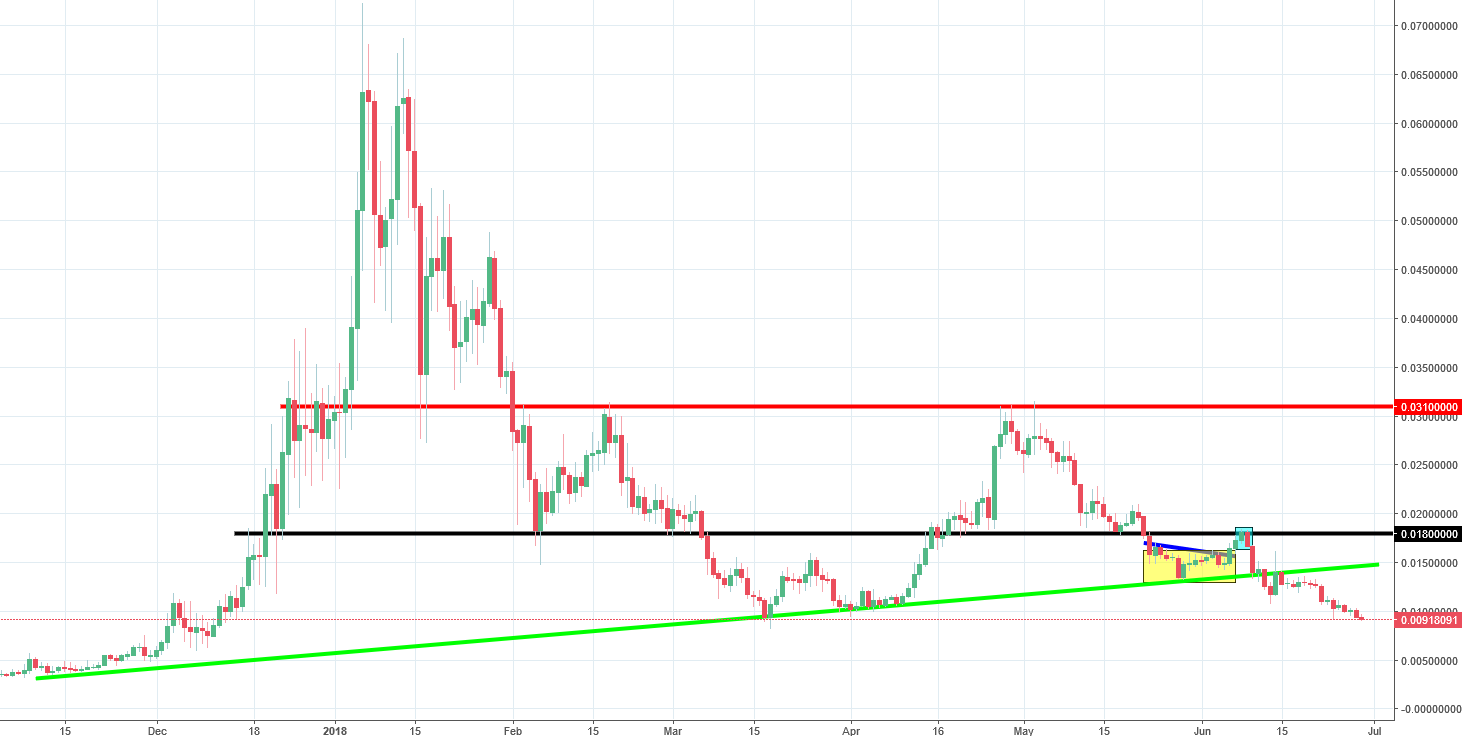
The price did touch the 0.018 USD resistance shortly after those words were written. We are happy that the price bounced from that level because it only conformed our analysis and showed us an importance of that area. SC bounced from that level, creating almost a bearish engulfing (blue area). Sometimes ‘almost’ is not enough but this time it worked. After the bounce from the 0.018 USD, the price declined sharply and managed to break the long-term up trendline (green). I think that ends the bull market here and sends this coin to the grave. Maybe that is harsh but technical analysis leaves no hope here and in the future, we should see even lower levels than now.


Comments (0 comment(s))