Steem Analysis – Not so bad but could be much better
Second altcoin, which is not doing particularly well is the Steem, which we analysed for the last time on the 3rd of April. Back in that piece we wrote:
“For the proper buy signal, we need to see the price closing above the major resistance on the 2.6 USD (red). It was with us since the June 2017 and did not lose the relevance since then. Our bullish view will be additionally supported by the breakout of the black down trendline (that fact alone is not significant enough – the line is too steep).
To wrap things up: daily candlestick closing above the red area will be a legitimate buy signal.„
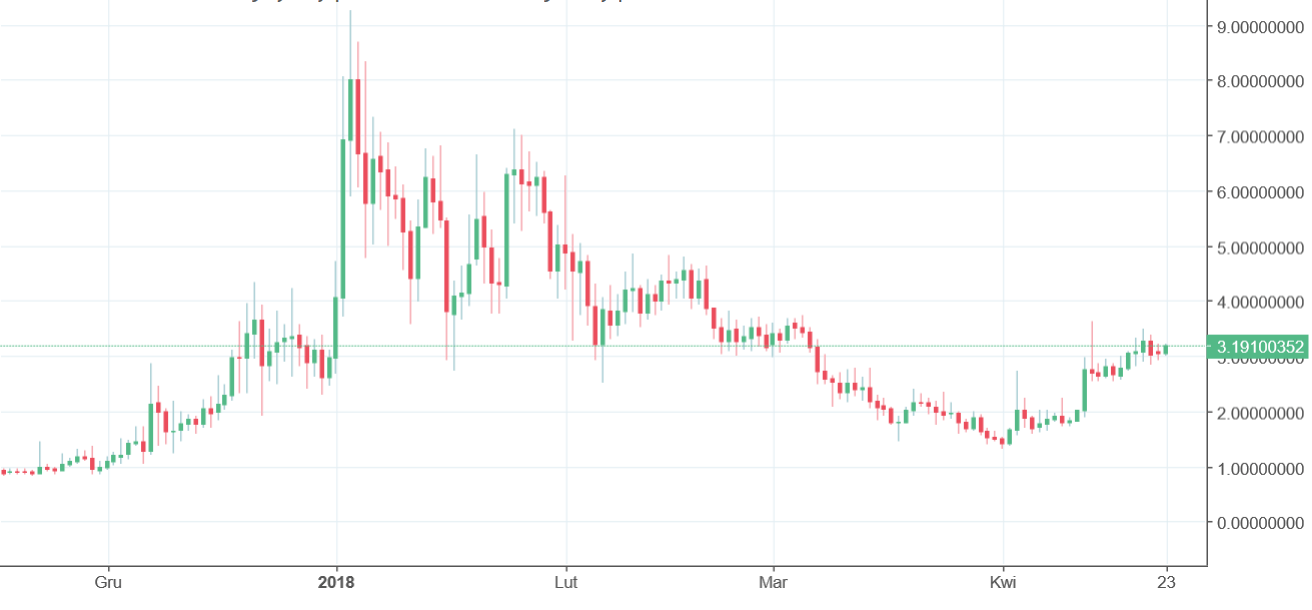
On the 12th of April, the price finally went up and did close above the 2.6 USD mentioned above. That was for us a buy signal and indeed we went higher. The day after, we managed to climb up to 3.6 USD so you have to admit that the signal was spot on. The price did not manage to hold high for too long but the reversal was not strong either. We went to test the 2.6 USD as a support and the test was positive for the buyers.
We said that Steem is not doing too well. The situation is bullish but it could have been much better. Buyers can be worried about the 3.4-3.6 USD area as the price tried to break it twice and twice bounced and went lower. Once this area will be broken, serious buy signal will be triggered. As for now, we wait.


Comments (0 comment(s))