Stellar Lumens Analysis – 3 USD soon…

European session on the crypto market starts with a really low volatility. It is hard to find an instrument, which is moving more than 3%. One of those, on the top of the list is the XLM. Stellar Lumens was previously mentioned here at the end of the September and back in that day, we were locked inside of the sideways trend. Despite that, there was a hope for a bullish movement:
“Recent few days brought us a reversal. We can see that the XLM is still fighting and the bullish potential here is much bigger than on the other major cryptos.
As for now, we are in a long-term sideways trend (blue and yellow). Price breaking the blue line will give us a buy signal. On the other hand, breakout of the yellow line will give us a sign to go short.”
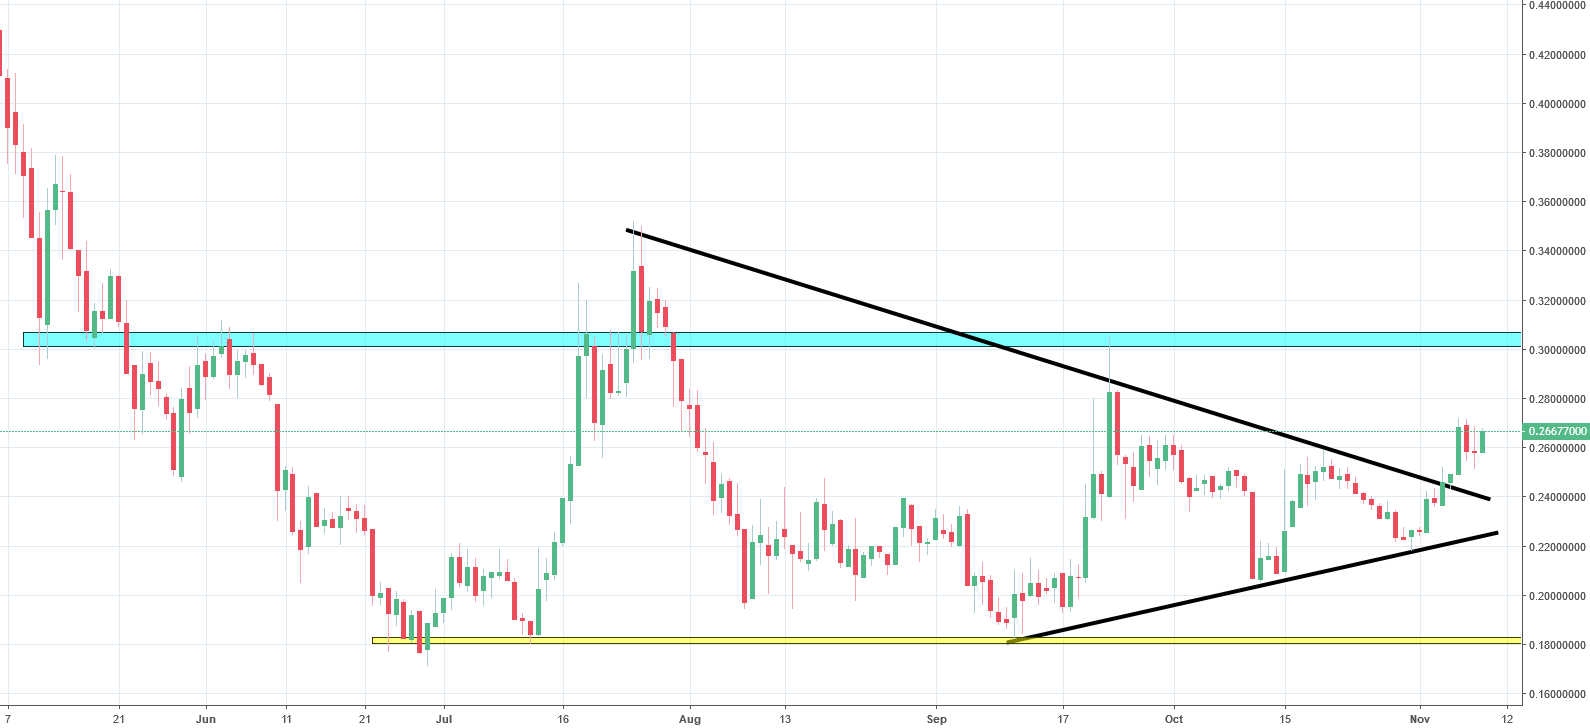
Unfortunately, price is still locked in the sideways trend. We should not be surprised though. Just look at the bitcoin – no movements whatsoever. Despite that, our positive view remains strong. The reason to back that up is that for the past few weeks, the price was creating a symmetric triangle pattern (black lines). At the beginning of the week, buyers decided to break the upper line of the triangle. That is a buy signal. As for the potential target, only one comes to mind – blue horizontal resistance. Chances that we will get there are quite high.


Comments (0 comment(s))