Stellar Lumens (XLM) Analysis – Long-term sideways trend

Thursday starts with the analysis of the Stellar Lumens, which today is one of the best cryptos among the top 10. Similar situation was here on the 19th of July, when we analysed this crypto for the last time. Back then, we were positive about the XLM future:
„Today, the price broke the blue resistance, which was important in May and beginning of June. As long as we stay above the blue area. The sentiment is still positive. „
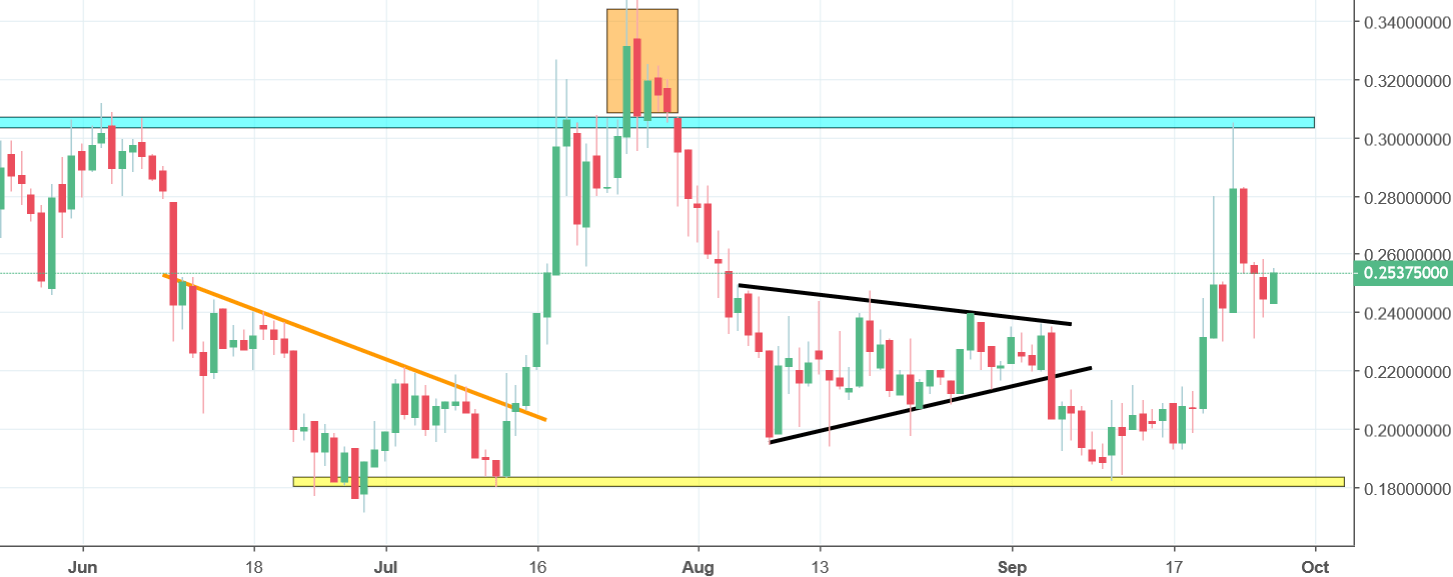
Bulls were winning here only for few days. The decline on Bitcoin affected everybody, including the XLM. July ended with a strong drop. At the end of August, XLM created a symmetric triangle pattern (black), which resulted with the bearish breakout. Recent few days brought us a reversal. We can see that the XLM is still fighting and the bullish potential here is much bigger than on the other major cryptos.
As for now, we are in a long-term sideways trend (blue and yellow). Price breaking the blue line will give us a buy signal. On the other hand, breakout of the yellow line will give us a sign to go short.


Comments (0 comment(s))