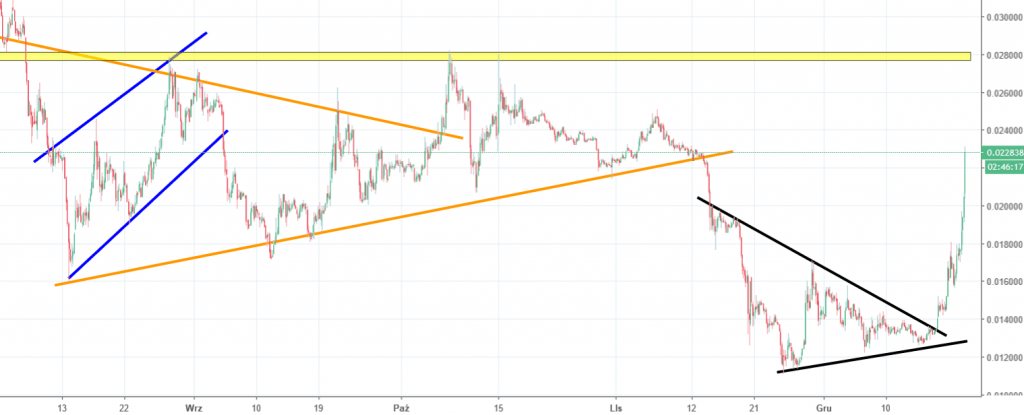
TRON Analysis – Aiming the 0.028 USD again

Technical part on Friday starts for us with a very important lesson about the breakouts and support and resistances. This lesson will be based on the example of TRON, which was previously mentioned here on the 9th of October, when the price was aiming higher but was still below a major horizontal resistance. Back then, we said this:
“As it often happens, after the breakout from the triangle, price has to challenge the horizontal resistance. In this case, that is a yellow area around 0.027 USD. Price closing a day above that area will be a buys signal. As long as we stay below, we cannot claim a bullish victory yet. „
The price did not manage to break the resistance, so there was no buy signal. That is why, the patience is one of the most important feature of every successful traders. Also that is why resistances are called resistances and why you should always wait for the breakout. Instead of going up, the price dropped like a rock, reaching new long-term lows at the end of November. That is the place, where TRON created a pennant (black lines). Surprisingly, on the 17th of December, the price broke the upper line of this formation, which triggered us a proper buy signal. Current target is the resistance from the previous analysis, so well know, yellow area around 0.028 USD.


Comments (0 comment(s))