TRON Analysis – Waiting for the breakout

Tuesday starts with the analysis of the TRON, which was previously analysed on the 28th of August, when the buyers had a great time, finishing the sixth bullish day in a row. Seeing this, we were quite optimistic about the future of this coin but the reality was different. This is how we concluded the previous piece:
„That actually ends the bearish sentiment and opens us a way toward the horizontal resistance on the 0.4 USD (orange). Chances that we will get there are pretty high. „
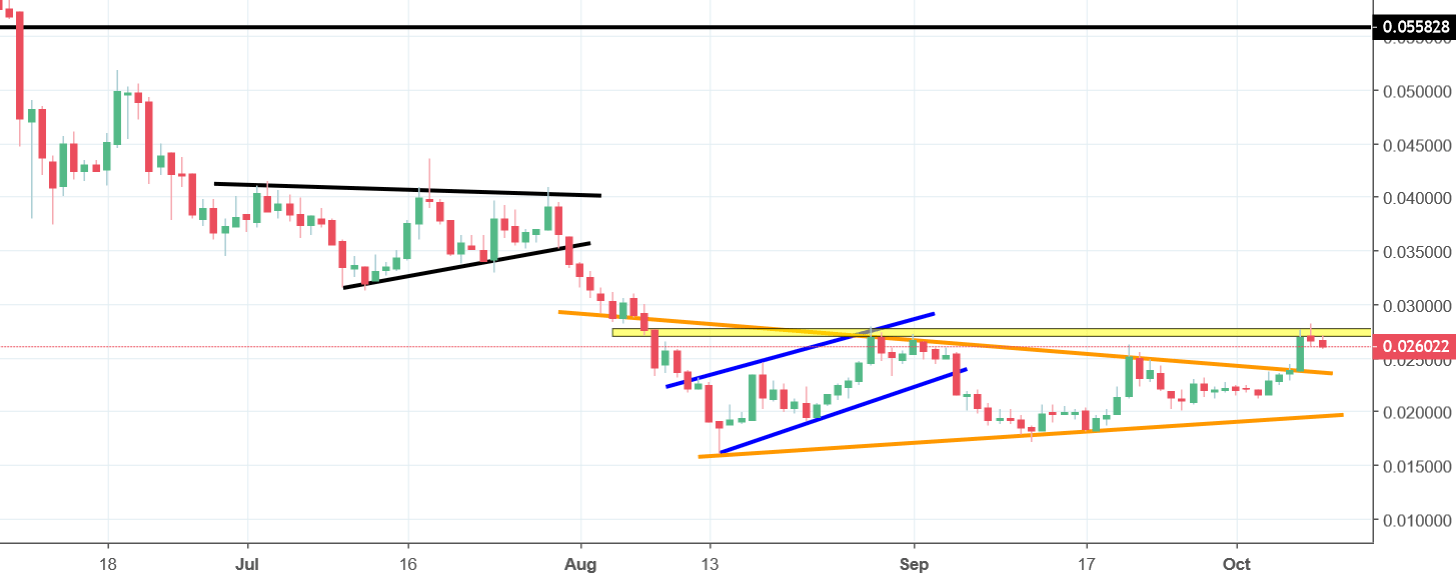
Further upswing did not happen and instead of that, TRX entered the correction stage. The correction is mild though and was shaped like a symmetric triangle (orange), so we did not see a huge decline here. In addition to this, triangle ended with a bullish breakout, which brings us right back to the bullish scenario. Yes, we have a positive sentiment but we do not have a signal yet. As it often happens, after the breakout from the triangle, price has to challenge the horizontal resistance. In this case, that is a yellow area around 0.027 USD. Price closing a day above that area will be a buys signal. As long as we stay below, we cannot claim a bullish victory yet.


Comments (0 comment(s))