Walton Analysis – 8 USD looks like a good resistance

Monday starts with the analysis of Walton. Previously we analysed this coin on the 21st of June, when the WTC was trading around the 7.94 USD. We were very bearish as the price was using a trend continuation pattern to come back to the main bearish trend:
“Today, price breaks the lower line of the pennant, which renews the sell signal. Negative sentiment will be denied, when the price will come back above the black line, which for now is very limited. „
After those words were written, the price declined sharply. On the 28th and 29th of June, the price reached lows on the 5.6 USD. Indeed, a great call from our analytical team. On those two days, the price also created the bullish engulfing pattern on the D1 chart, which was the beginning of the bullish reversal.
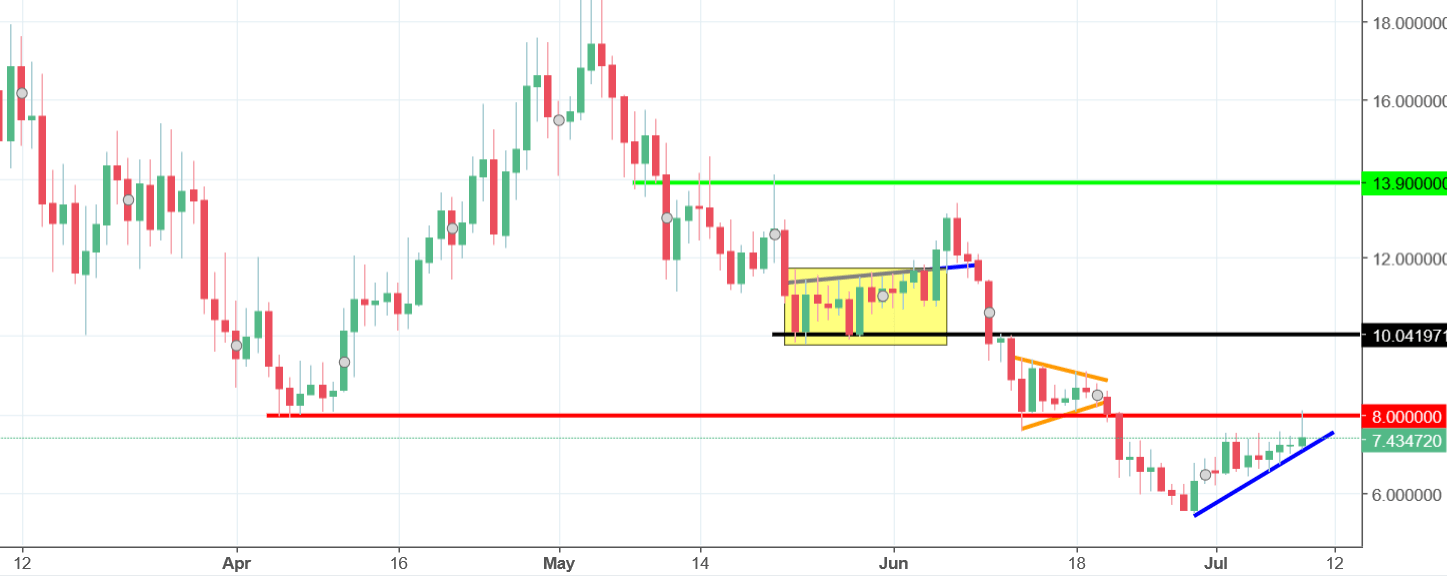
The upswing aimed the previous support on the 8 USD and today, tested that line as a resistance. As for now, the test is positive for sellers as the price created the shooting star candlestick. As long as we stay below the red line and this pattern is present, the sentiment is negative and we should come back to the downswing soon.


Comments (0 comment(s))