Walton Analysis – Pennant promotes the further drop

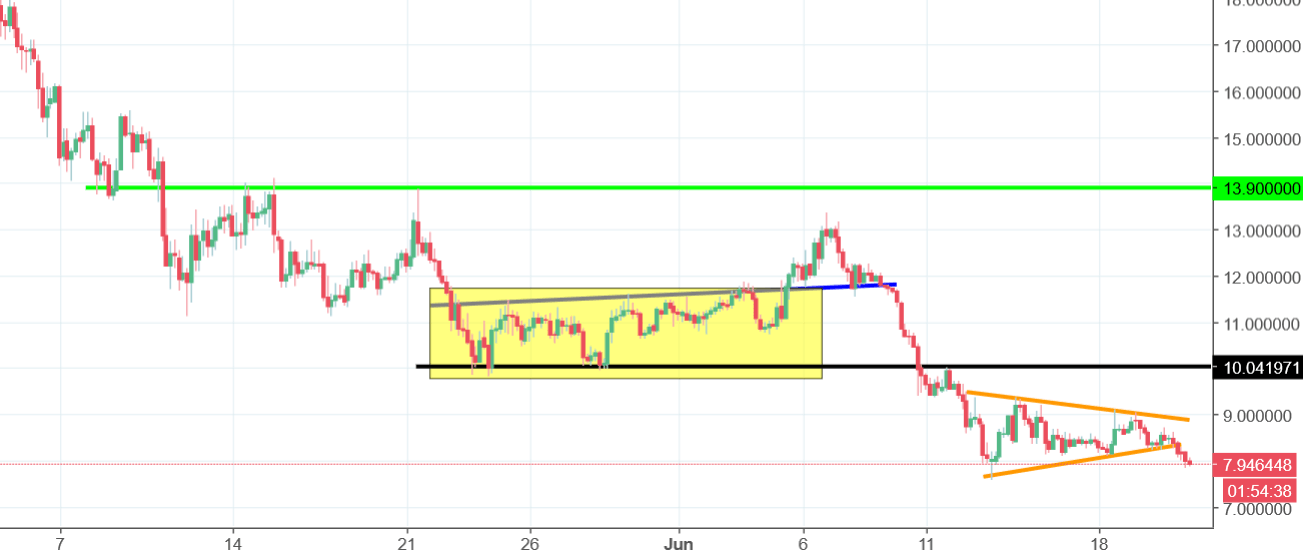
Second piece of the day is about the Walton. On the 7th of June, when we analysed this coin for the last time, we were positive. The optimism was caused mostly by the inverse head and shoulders formation, which emerged on the mid-term chart. We stated this:
„Short-term sentiment stays positive, even despite the fact that the WTC is going down heavily today. As long as we stay above the neckline (blue), we are still good here and we should see a further rise. Price coming below the neckline will mean a sell signal but chances for that are now a bit smaller. „

Price broke back the neckline and went lower. The breakout itself was indeed a sell signal. After that, the price dropped like a rock. First, they broke the horizontal support on the psychological round barrier of 10 USD (black). After that, WTC created a pennant (orange lines), which promoted further downswing.
Today, price breaks the lower line of the pennant, which renews the sell signal. Negative sentiment will be denied, when the price will come back above the black line, which for now is very limited.


Comments (0 comment(s))