Walton Analysis – iH&S to the rescue!
Second analysis of the day is another proof, why is it worth to follow us and read our analysis very carefully. In this piece, we will analyse the Waltonchain, which was previously mentioned on the 9th of July, when the price was bouncing from an important horizontal resistance. We were bearish and that is what we wrote back then:
“The upswing aimed the previous support on the 8 USD and today, tested that line as a resistance. As for now, the test is positive for sellers as the price created the shooting star candlestick. As long as we stay below the red line and this pattern is present, the sentiment is negative and we should come back to the downswing soon. „
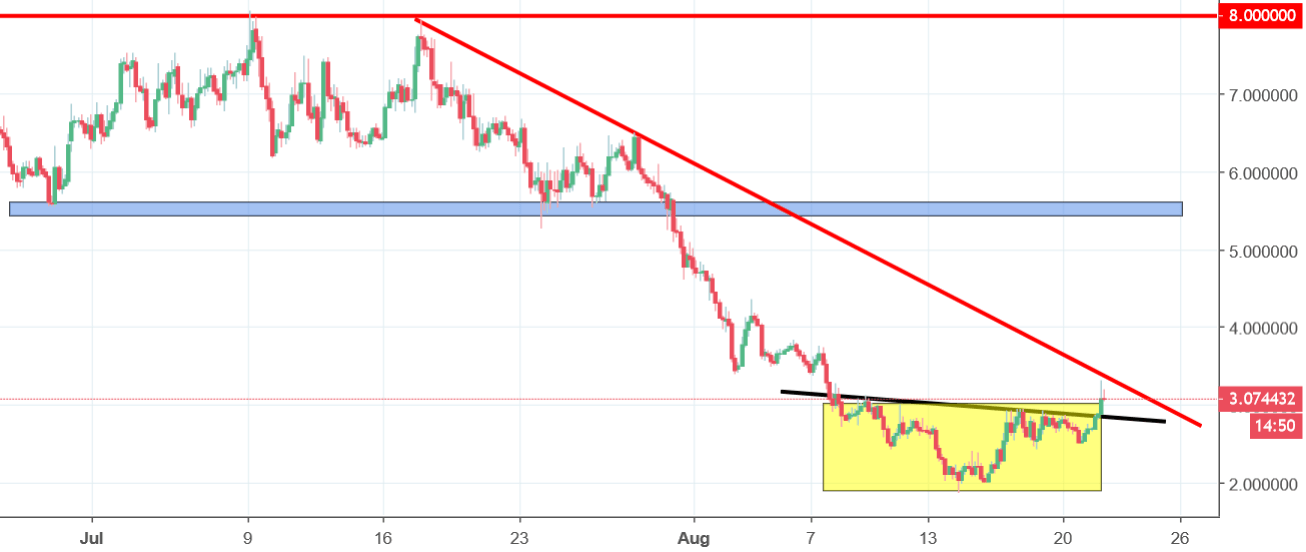
After those words were written, the price was never higher! Yes, after some time, we tested the 8 USD again but the outcome was negative and we went down almost without any brakes. In the middle of August, the price reached lows around 1.9 USD. What a drop!
It seems that the 1.9 is the current bottom. The price created an inverse head and shoulder pattern (yellow), which is a bullish trend reversal pattern. Formation is active as we already broke the neckline (black). The first target was reached today – mid-term down trendline (red). I think that chances for a breakout are quite high and in that case, the focus will be on the horizontal resistance marked with a blue colour (around 5.5 USD). Buy signal will be denied, when the price will drop below the black line.


Comments (0 comment(s))