Walton Analysis (WTC) – Broken 15 USD means trouble

The last piece is about the Walton. Our previous analysis was written on the 25th of April, when the price was bouncing from the resistance on the 15 USD. We were slightly more bearish but the price eventually broke that resistance and went significantly higher. That movement was a part of the wedge formation (pink lines), which is coming to an end as we speak.
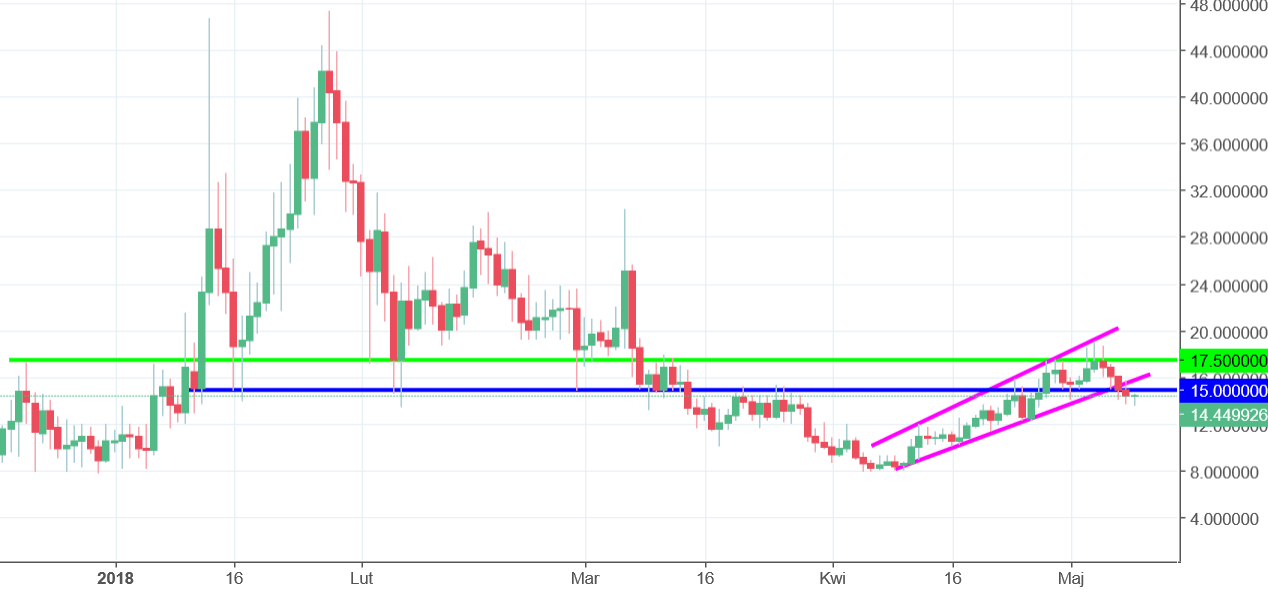
After breaking the 15 USD resistance, altcoin went to test the 17.5 USD (green) one and did not succeed with the breakout. They tried few times but none of the daily candlestick managed to close above the resistance. That weakness triggered a correction, which resulted in four bearish days in a row. The price broke the lower line of the wedge and the 15 USD mentioned above (blue). That actually sets the sell signal here and is a negative factor in the mid-term.
As long as we stay below the blue line, the sentiment is negative. Comeback above the blue area will deny the sell signal but the chances for that are now limited.


Comments (0 comment(s))