Wanchain Analysis – Broken 2 USD sends the price much lower

Thursday starts with the analysis of the Wanchain, previously mentioned by us on the 2nd of July. If You are following us for some time, you know that we are mostly right. I would say that 80% of our analysis end up with profits. That is a good number but it shows us that we are not right every time. With still have to deal with those instruments that had bad predictions. WAN is one of them. Back in that day, we were bullish but the price went the other way:
„Most recently, the price formed a tight range (rectangle, yellow), which finished with the breakout of its upper line. Together with the breakout of the down trendline (red), that is a strong buy signal. As for now, we are up almost 3% but in my opinion this is not the end and in the next few days, we should climb vastly higher. „
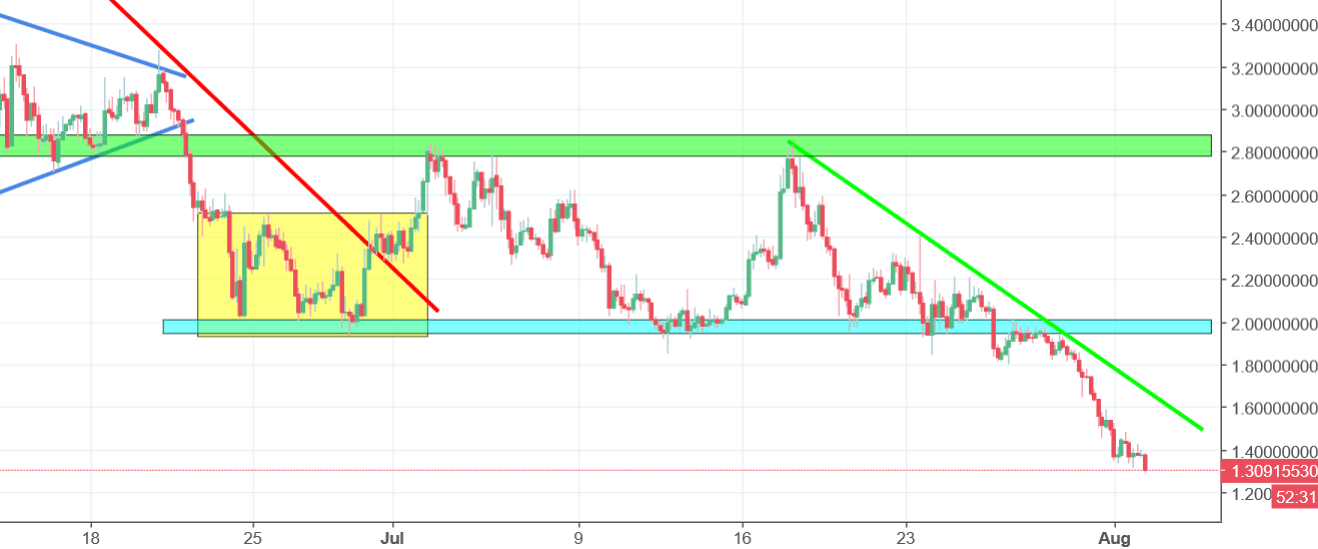
As we said, the price failed to enter the bullish territory. Instead of that, we were locked inside of the sideways trend between the green and blue areas. Most recently, the price broke the blue support around the 2 USD, which gives us a legitimate sell signal. As long as we stay below this line, the sentiment is negative and the price should continue to decline.


Comments (0 comment(s))