Waves Analysis – 2.65 USD on the horizon
Today we will analyse Waves. As You probably already know, most of the charts of the cryptos, look the same. There is nothing, then at the end of the year there is a rocket flying to the space making 1000x % profits and then there is a huge reversal,which usually starts in January and continues till now. With Waves it is a little bit different.
Waves had some nice movements since May. The price went from peanuts to 7USD and then created a symmetric triangle pattern (upper blue and lower green line). In November, we broke the upper line of this formation, then used that as a support and then the price surged higher. The all time high was made on the 19USD. That was in the middle of December and from that point, the bearish trend started.
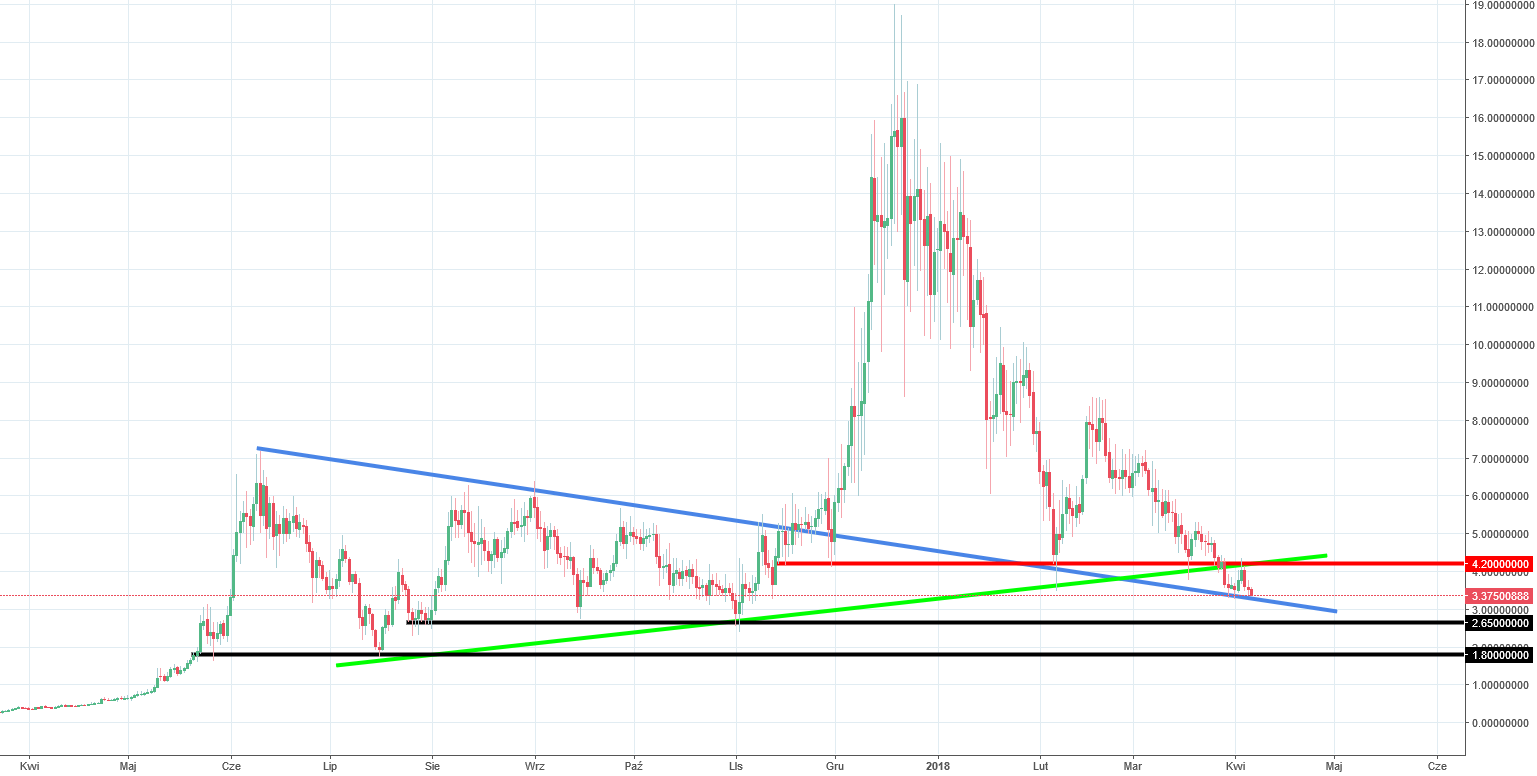
Although we are currently in a place with lots of supports, the situation does not look great. We broke the 4.2 (red) support and the lower line of the triangle (green). At the beginning of the week, both of them were confirmed as a strong resistances. Currently, WAVE is quoted around 3.42 but we should reach the 2.65 USD soon. That is a support created by the lows from July, September and October 2017. Bearish sentiment will be denied, once the price will break the 4.2 USD resistance, which for now, seems less likely to happen.


Comments (0 comment(s))