Waves Analysis – 5 USD bounce, 4 USD breakout, 3,3 USD target.

What is the sound of the bursting bubble? I do not know but maybe this one that we heard on the crypto market on Sunday? After the weekend, almost all altcoins have deep troubles. We were negative before but thanks to this weekend, the bearish movement accelerated. On most of the instruments, that was expected. Let me show You the Waves Coin and the analysis that we wrote on the 31th of May, when the price was around the 4.13 USD:
„The price is very close to the horizontal support on the 3.3 USD and I think that the gravity may do its job and the price can decline further touching the green area. That is our view for the Waves now: further drop aiming the long-term horizontal support. „
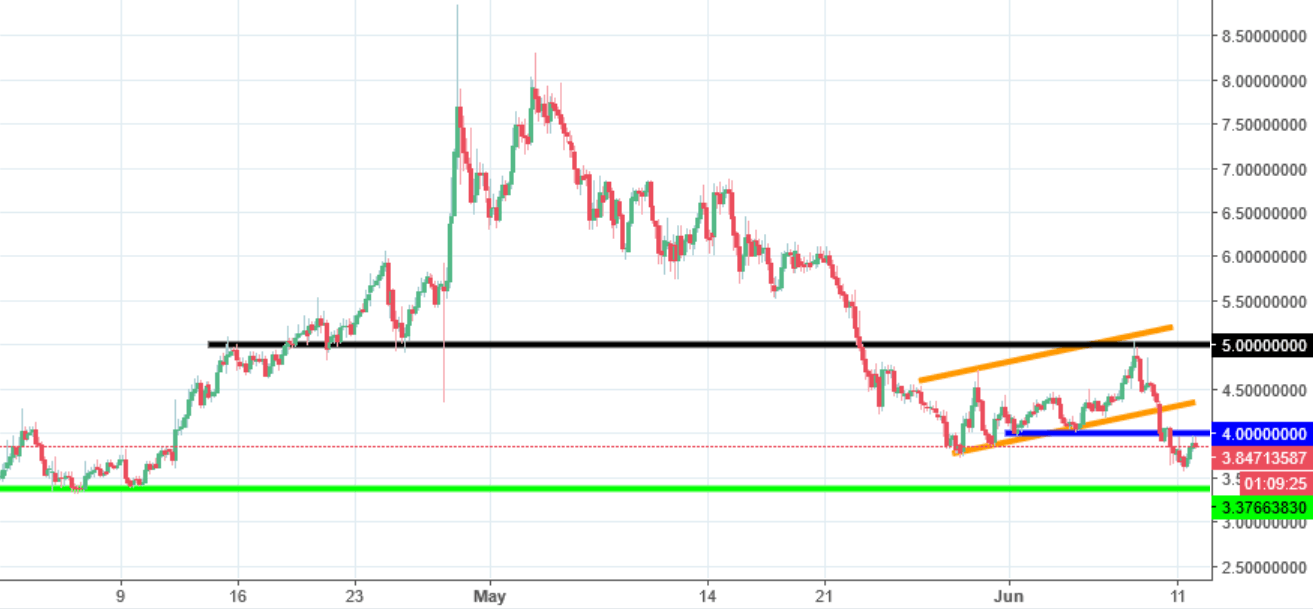
Currently we are on 3.8 USD, recovering from the drop to 3.6 USD, so You can see that our view is in play right now. Since our last analysis, Waves made very interesting, technical moves. First of all, the price created a correction pattern (flag, orange lines) and aimed the 5 USD resistance (black line). After the bounce, the price dropped breaking another key round level – 4 USD (blue) and this one is now tested as a closest resistance. The first contact is negative and the price draws long heads on the H4 candles. With this kind of Price Action, our previous view of the price touching the 3.3 USD remains untucked.
Negative scenario stays on the table as long as the price stays below the resistance on the 5 USD.


Comments (0 comment(s))