XLM Analysis – Lower lows and lower highs

Time to check the situation on our old friend: Stellar Lumens. It has been a while and we did not talk about this crypto since the end of April. In our previous piece, we were signalling the possible breakout of the horizontal resistance:
“Breakout of the red line (0.4 USD) should trigger us a new buy signal. „
Shortly after this, the price did break the red line and went significantly higher. The upswing did not last too long. Apparently XLM was too tired with the upswing seen in April and obviously, the overall situation on the crypto market did not help the buyers. Whatever the main reason was, the price started to go down and entered the bearish territory.
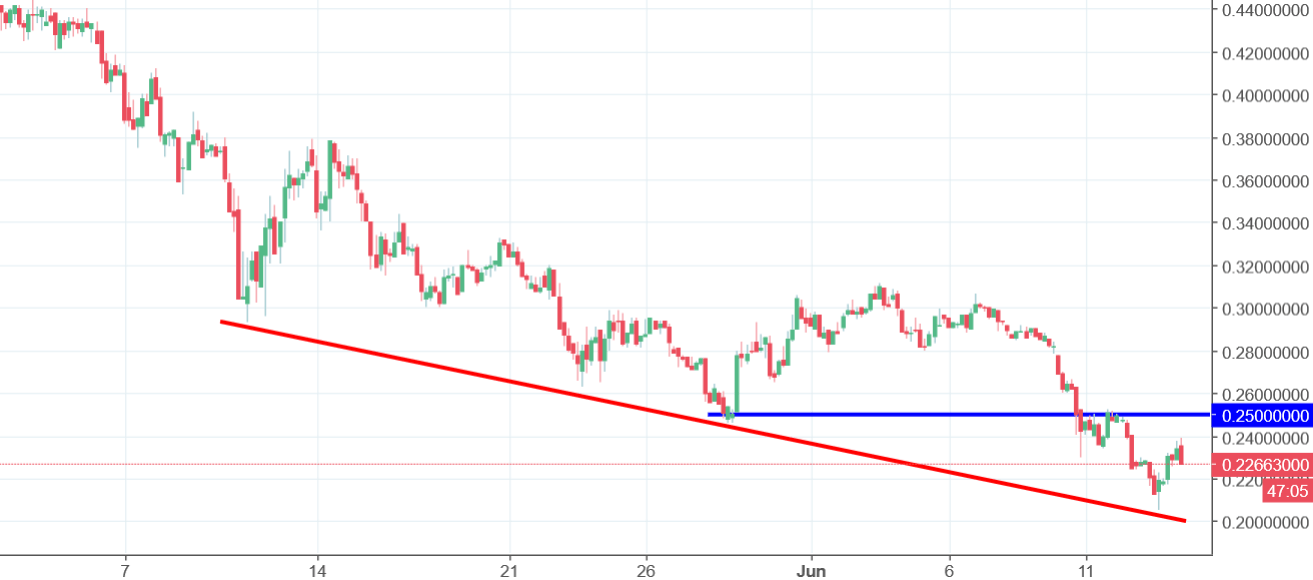
Currently, we are in a down trend and the price is making lower highs and lows. The sell signal is present as long as we stay below the blue horizontal resistance on the 0.25 USD. Today’s session is so far positive but at the end of the European session, buyers are loosing a bit of initiative. Sell signal is on.


Comments (0 comment(s))