Zcash Analysis – There is a bearish flag but…
Friday starts with the analysis of the Zcash, which is one of the best performing cryptos on the market today. Zcash is climbing slightly more than 4% today and is extending the correction that started on the 3rd of October. Previously, we mentioned the ZEC on the 11th of September, when the price was around 118 USD. Back in that day, we were bearish and we were warning our fellow traders from this instrument:
„Currently, the volatility dropped and the price is laying on the mid-term lows. That is a clear signal that sellers are getting ready for a major breakout. Sell signal is on as long as we stay below the blue area. „
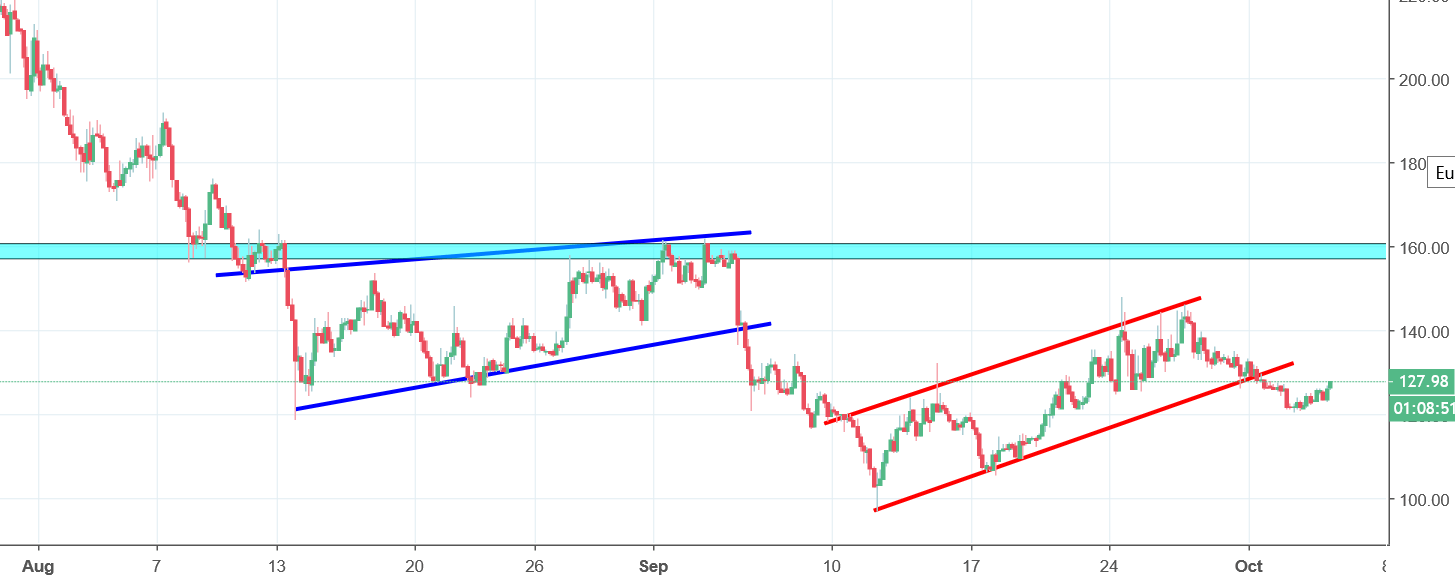
A good call and timing was perfect too as a day later, the price was already below the 100 USD! Almost 20% drop in one day, wow! After this, ZEC entered the correction stage. The price created a flag pattern and went higher (red lines). That was just the correction though. On the 1st of October, ZEC broke the lower line of the flag, which in theory gave us another sell signal. It would all look perfect but in the past few days, the price is climbing higher. Yes, as long as we are below the blue area, the sentiment is negative but the price is not going down as it should (after the flag). That may be a sign of a strength so better be safe than sorry – sell signal will be triggered only when the price will break the lows from the 3rd of October.


Comments (0 comment(s))