AUDUSD Anslysis – We are very close to a major sell signal

Time for an update of the AUDUSD, which was mentioned here for the last time two days ago, when the price was testing the neckline of the Inverse Head and Shoulders pattern. For us, that was a good place to buy. Let’s see what happened.
“It is pretty common that the broken neckline is later tested as a support. Which is happening right now, as we speak. As long as we stay above the grey line, the buy signal is on. „
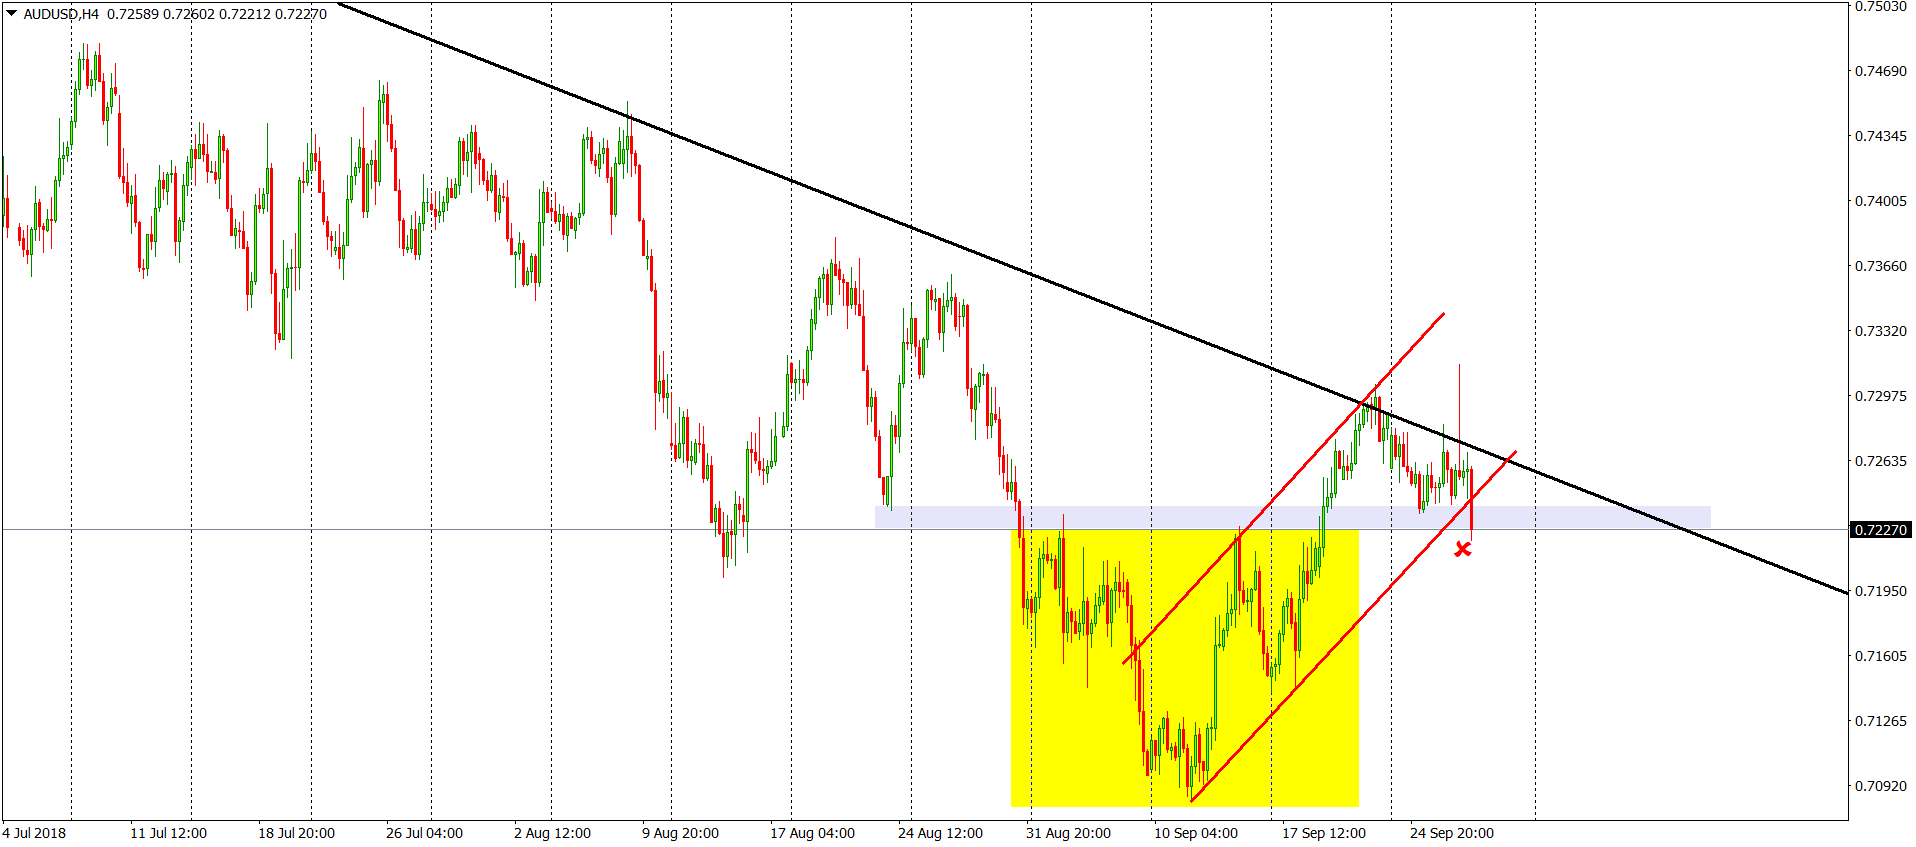
After those words were written, the price indeed went higher – the neckline was defended. Fair enough but then, FOMC came. The press conference, statement and decision, all at once. What is more, the price reached the long-term down trendline (black). The combination of those factors gave us a drop. AUDUSD bounced from the down trendline and broke the lower line of the flag pattern (red). What is more, we are currently breaking the neckline of the iH&S formation mentioned above. Once sellers will close the H4 candle below the grey line, we will get a legitimate sell signal. Chances for that are pretty high.


Comments (0 comment(s))