CADCHF Analysis – Yep, that was expected

Time for an update about the CADCHF, which was previously mentioned on our portal on the 14th of November. Back in that day, we were bearish but without a trading signal. The price was locked inside of a symmetric triangle but we got the strong feeling that the breakout would be to the downside, check out yourself:
“Price closing a day, below the purple area will be a legitimate signal to go short. On the other hand, the bounce and the breakout of the upper line, will be a strong buy signal. Somehow I think that the first option is more probable and I will be more preparing for that scenario. “
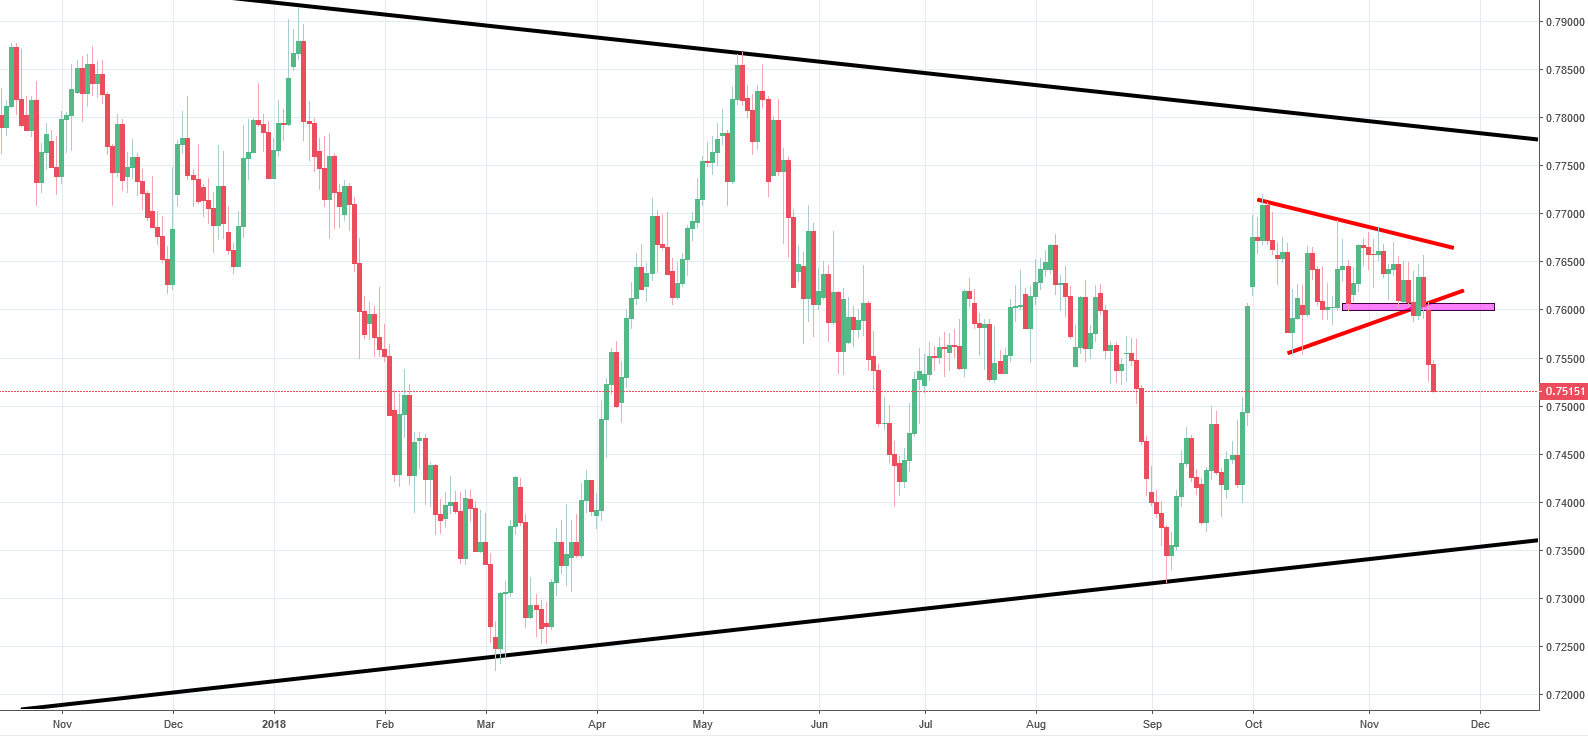
We were right. The price broke that support for good on Monday. That was it. Everybody saw that triangle on the chart, so reaction could be only one – massive drop. CADCHF is currently on the way towards the lower line of much bigger triangle. The lower black line is the aim, which still makes it a good trading opportunity. Unfortunately the risk to reward ratio is a bit worse than initially and the risk of the bullish correction is much higher now. Going short now is maybe no the best idea on the record but after a small bullish correction, why not?


Comments (0 comment(s))