Dollar Index Analysis – Head and Shoulders?

Traders on the Dollar Index can be now a little bit confused. Both of the sides of the market have their own arguments and can be somehow confident about the victory. Our last analysis of the DXY was made on the 8th of November and we will deal with that one first, before we will move on to the current situation. Here is our view from the previous piece:
„Thanks to this, instead of the H&S pattern, we received the wedge (red lines), which is promoting a further rise. The proper buy signal will be triggered, when the price will break the upper line of the wedge, which can happen really, really soon. „
The proper buy signal was created, so we were right about that one. After the breakout, the price made new long-term highs and crated another wedge (black lines). Wedge allowed the DXY to touch and bounce from the up trendline (blue), which is definitely a point for the buyers. What is more, Dollar Index broke the upper line of the wedge, which in theory brings us a buy signal.
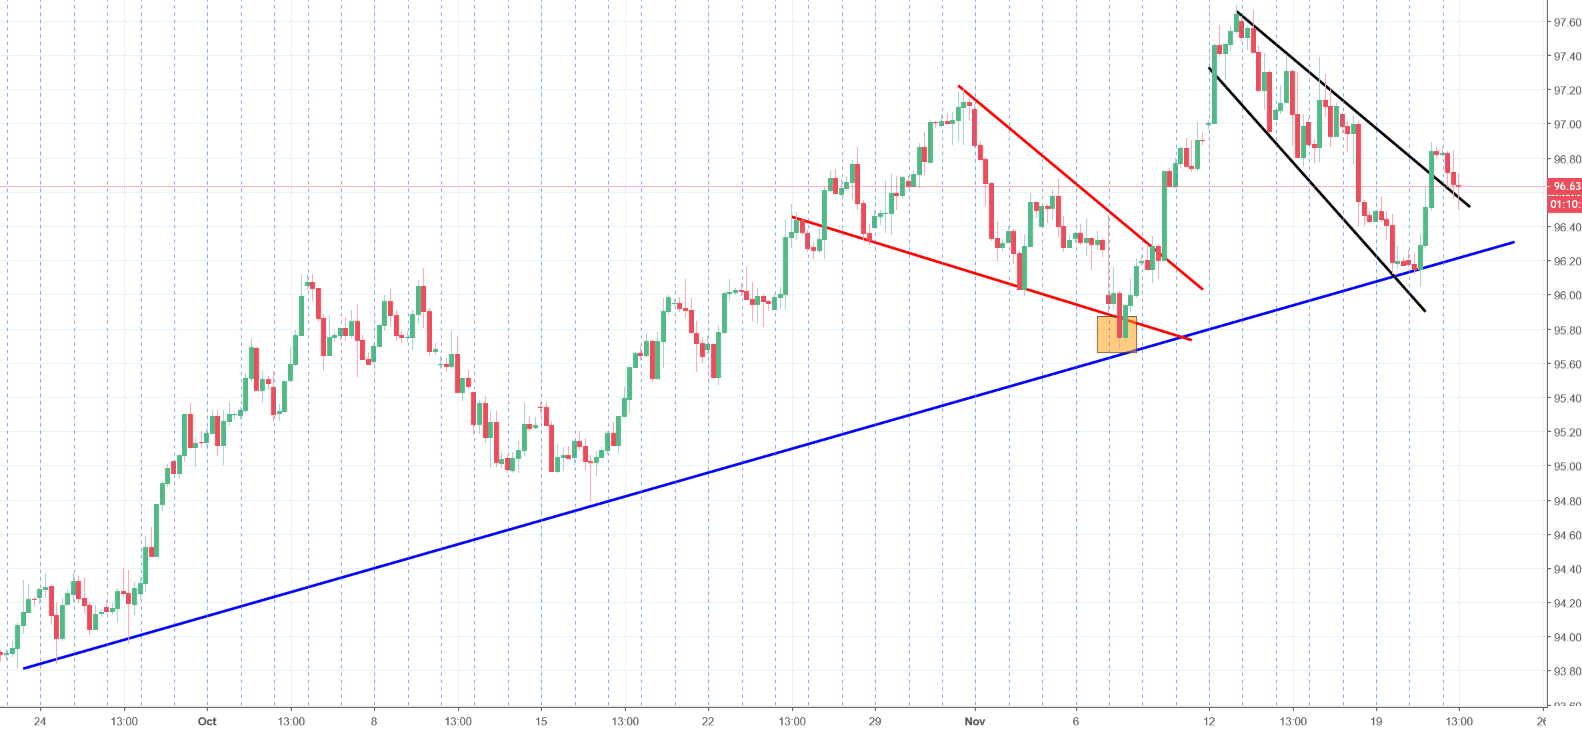
So buyers are winning right? Not so much. As you can see, traders are not following this signal from yesterday and the price is going down. That can give us a head and shoulders pattern, which may be very negative here. As for now, that is just a bearish dream as for the proper signal, we need to see the breakout of the neckline. As long, as we stay above the blue line, the sentiment is positive.


Comments (0 comment(s))