Dollar Index Analysis – H&S or wedge?

A lot is going on on the USD recently. A lot will be going on too, especially today, as we do have the rates decision and the statement from the FOMC. Before I will tell You about my current view on this instrument, first, we need to deal with the previous piece, from the 26h of October. Back then we were bullish and we said this:
“History likes to repeat itself so we should see the breakout of the upper line of the flag soon. Our scenario for this instrument remains is positive. „
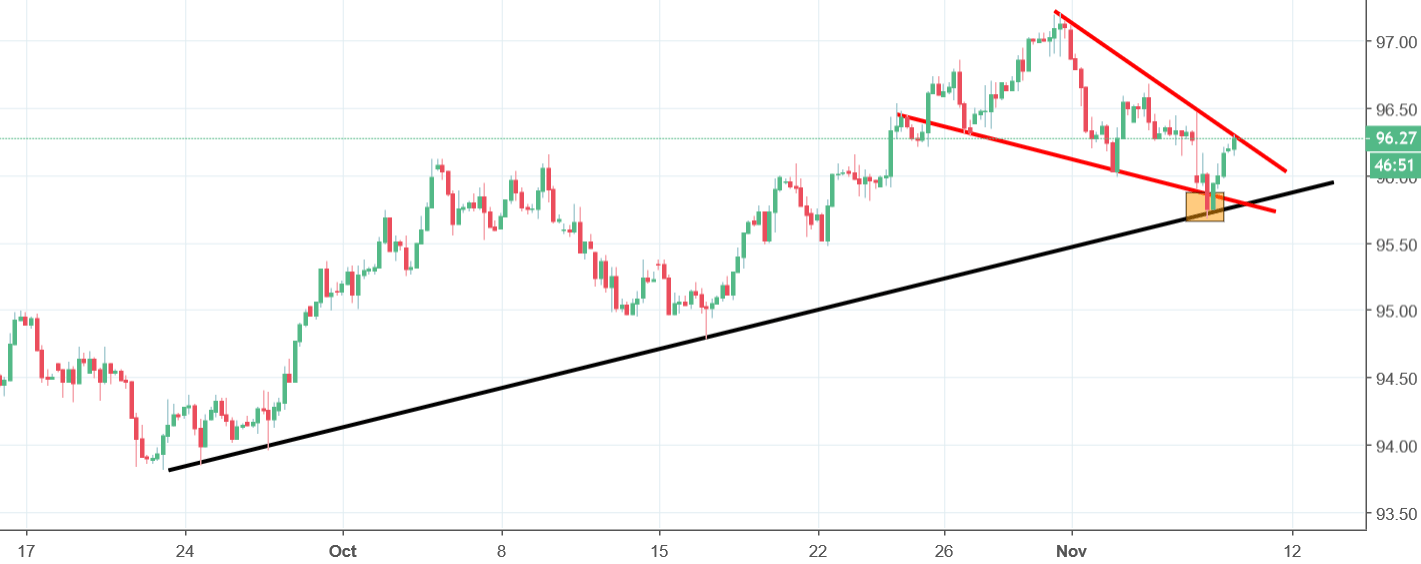
The price was indeed going higher till the very end of October. First days of November brought us a correction, which managed to create the head and shoulders pattern. Interestingly, yesterday we got a breakout of the neckline (lower red), which in theory gave us a sell signal. Just in theory though, as in practise, it looks more like a false breakout pattern, especially that the DXY bounced from the mid-term up trendline (black). Thanks to this, instead of the H&S pattern, we received the wedge (red lines), which is promoting a further rise. The proper buy signal will be triggered, when the price will break the upper line of the wedge, which can happen really, really soon.


Comments (0 comment(s))