Dollar Index Analysis – Test of a major horizontal support

Dollar is about to end this year on the back foot. At least the last full week of trading. EURUSD is close to the weekly highs, USDJPY is close to the weekly lows, so naturally DXY is also near the bottom. Previously, we analyzed this instrument at the end of November, when the price was close to the major up trendline. Back in that day, we wrote this:
„Thanks to this, you know how to trade it. As long as we are above, we do have a buy signal. DXY closing a day below, will be a signal to go short and to be honest with you, quite a strong one. „
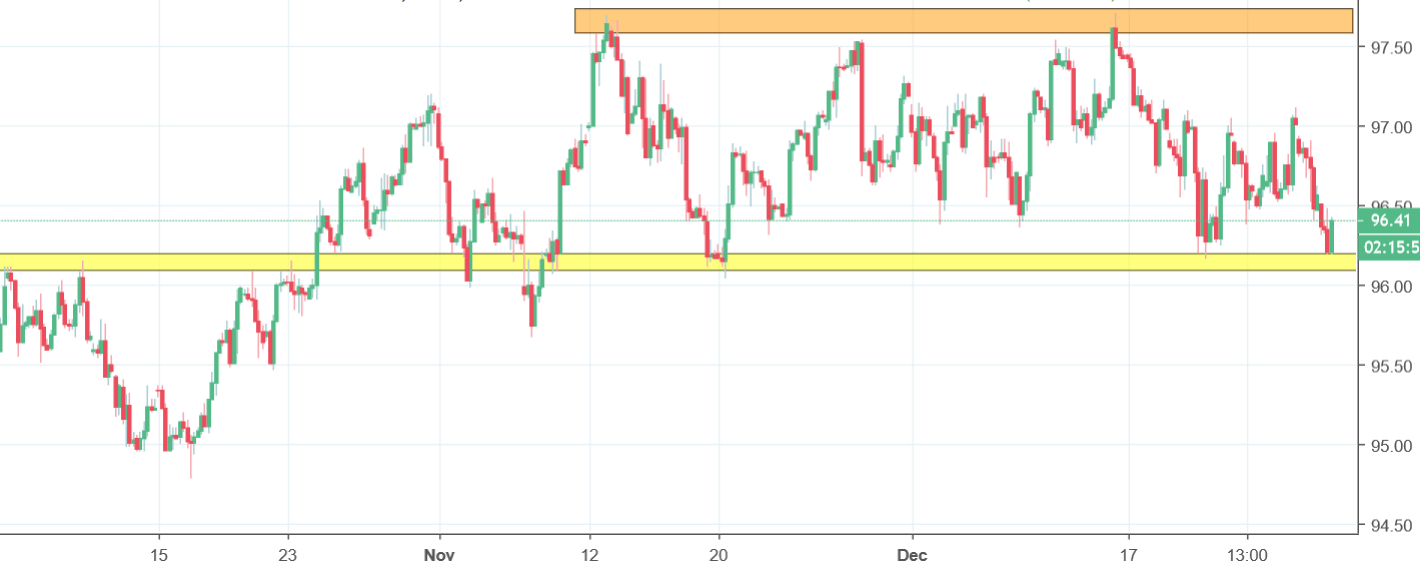
Apparently, this trendline was not that important as we expected. The price broke it, went lower indeed but then quickly recovered. We made local lows, then highs and then lows again. What the price told us is that the most important element here was not the up trendline but the rectangle (tight range) between the orange resistance and the yellow support. Two weeks ago, we tested the resistance and now we are testing the support. Breakout of the yellow area is currently more probable and can be really lethal. The first contact is positive for the buyers as we see a bounce but it is hard to tell how sustainable it can be. What you should know for now is that when the price will close a day below the yellow area, we will get a strong sell signal.


Comments (0 comment(s))