EURJPY Analysis – Failed iH&S pattern

The last instrument in the technical part will be the EURJPY, which is having quite a negative situation at the moment. From the fundamental point of view, most probably, we are influenced by the weaker GDP data that hit the screen recently. Previously, we talked about the EURJPY on the 14th of September, when the price was having a very promising situation:
“The outcome of this formation was a bullish breakout, which in theory, brings us a proper buy signal. Positive sentiment will be denied, when the price will come back and beat this week lows. That is currently less likely to happen and according to the price action, we should see a further upswing. „
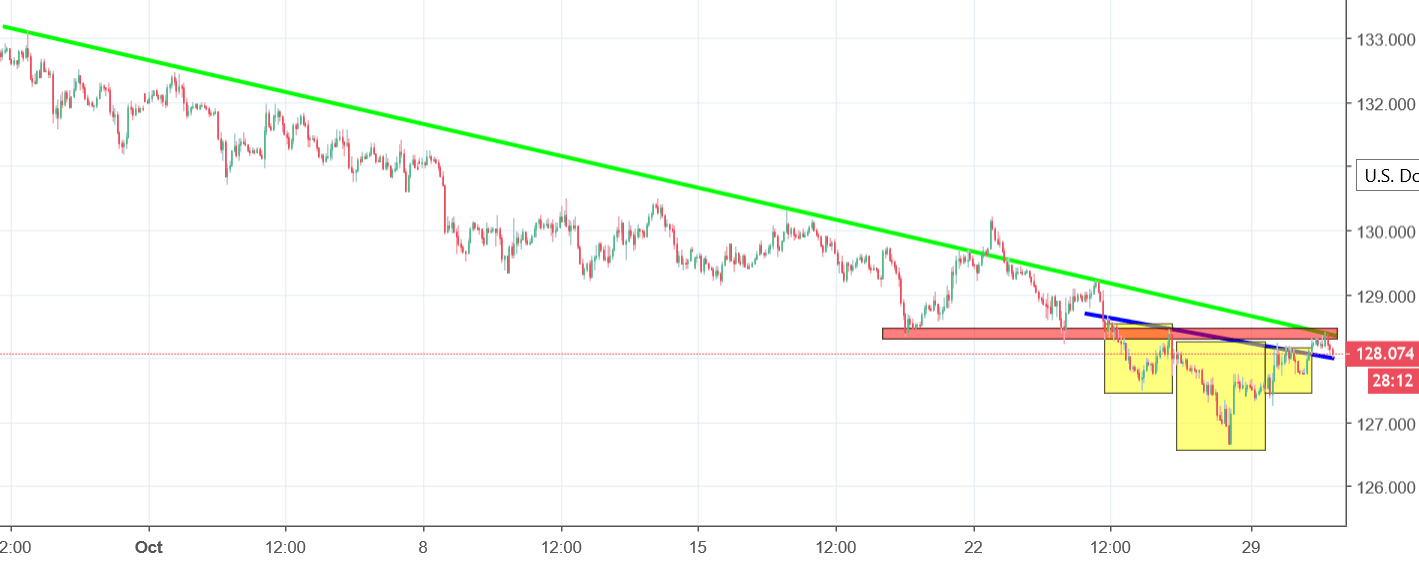
That was a great mid-term call. In the next few days, the price went almost 200 pips higher and reached the highest levels since April. That was it though. EURJPY entered a deep down trend and went lower. Since last Wednesday, buyers managed to create the inverse head and shoulders pattern (yellow), which had a chance to stop the decline. Unfortunately for the buyers, the rises stopped quickly, on the down trendline (green) and the horizontal resistance (orange lines). That creates a very negative situation here, which should result with a continuation of the main trend. Our view on this instrument is negative.


Comments (0 comment(s))