EURUSD Analysis – and we are back above the 1.13

Time for a small update about the EURUSD, which most recently broke the support on the 1.13. We wrote about that in our previous analysis from the 12th of November. That breakout gave us new long-term lows, so in the same time a long-term sell signal. We concluded the previous piece in a following way:
“The breakout of the lower line of the flag sorted out everything. We went to the full bear more. Today, price managed to break the 1.13 support (yellow). That is very negative and gives us a major long-term sell signal. „
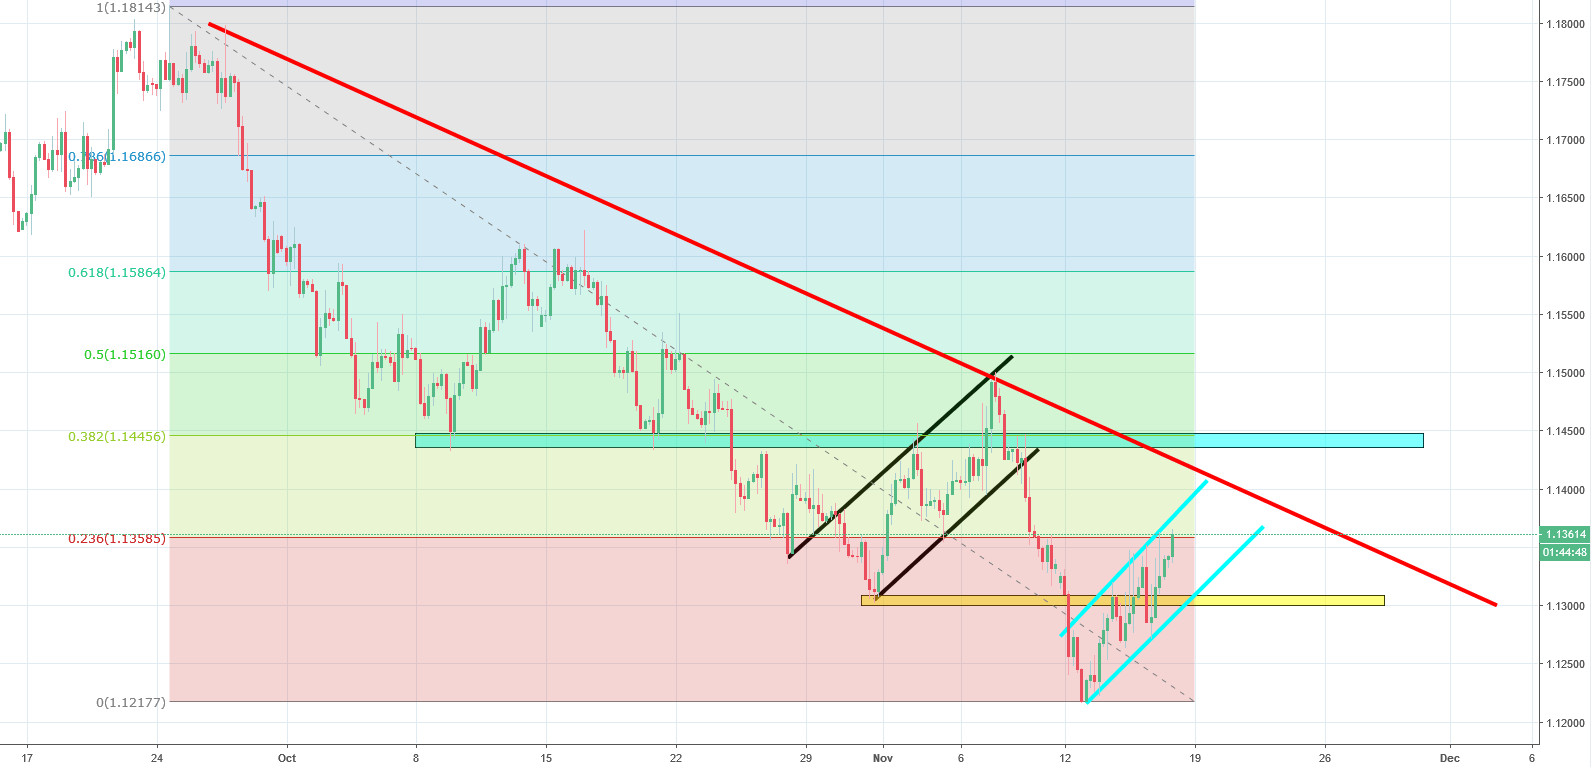
Sell signal is still intact but since those words were written, we do have a small bullish correction. Small because it has only 130 pips but in the same time, is quite successful to be honest with you. The thing is that the price managed to climb back above the 1.13, which apparently was not such a strong resistance as expected. This is still just a correction though. First of all, we are inside of the flag (blue). We are also below the down trendline (red) and the 38,2% Fibonacci.
The sell signal is ON, as long as we stay below the blue resistance.


Comments (0 comment(s))