EURUSD Analysis – EUR goes down again

Now, time for the EURUSD, so the most popular instrument on the Forex Market. Previously, we mentioned this pair on the 8th of October, when the price was close to the local lows and we were waiting for the further drop:
“After the successful breakout of the orange line, EURUSD should aim for the lows from the mid of August. The price reaching that area is very probable. „
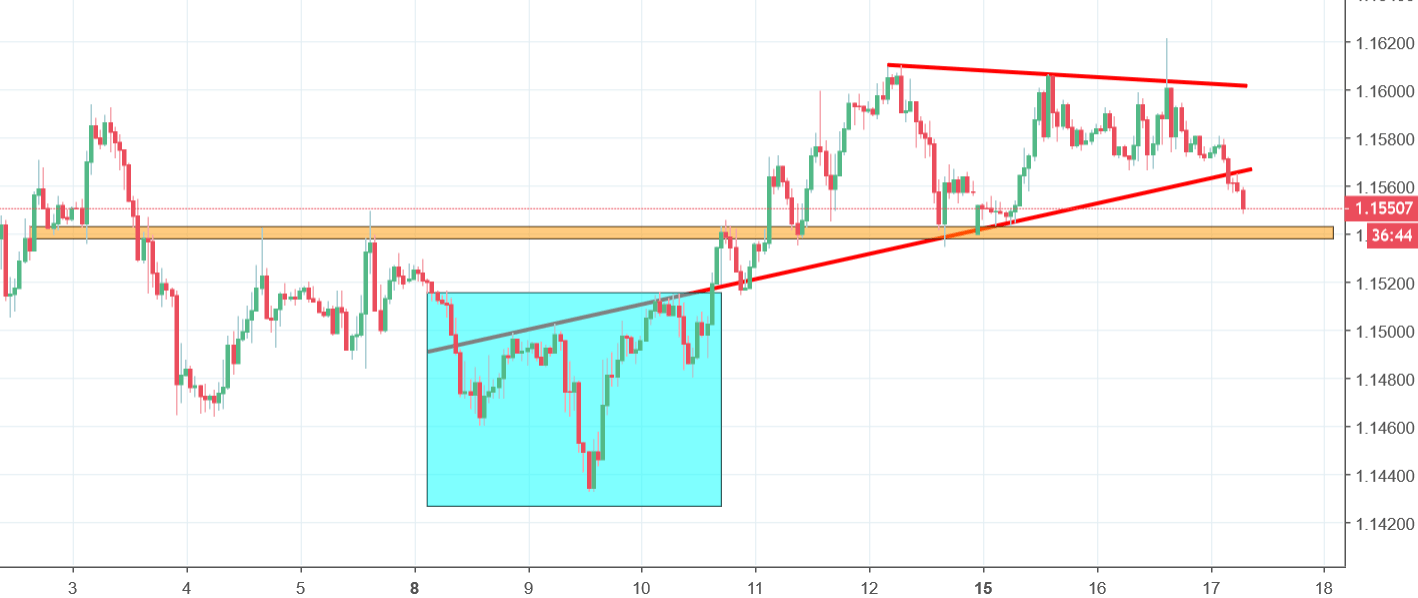
The price indeed went lower afterwards but only one day and ‘only’ 70 pips. Bad for the long-term traders, great for the short term days traders. After reaching the lows on the 9th of October, EURUSD created an inverse head and shoulders pattern (blue) and went higher. The most recent formation is the red triangle, which resulted with the breakout to the downside and that brings us a negative sentiment here. The closest target is on the orange horizontal support and the main scenario says that we should get there soon. Short-term sell signal will be cancelled, when the price will come back inside to the triangle.


Comments (0 comment(s))