EURUSD Analysis – False breakout

Last instrument today is the EURUSD, where yesterday we had got a proper buy signal and straight after that, a cancellation and a signal to go short. Interesting times we live in, huh? Before I will explain the current situation in a greater detail, I need to tell You about our previous piece about this pair. It was written on the 28th of November and our view there was bearish:
“That means that this pattern was fake, false and denied and that usually is a strong trigger to take the opposite stance. On top of that, we are additionally back below the 1.13, which was an important psychological support. Next few days should bring us a further decline. „
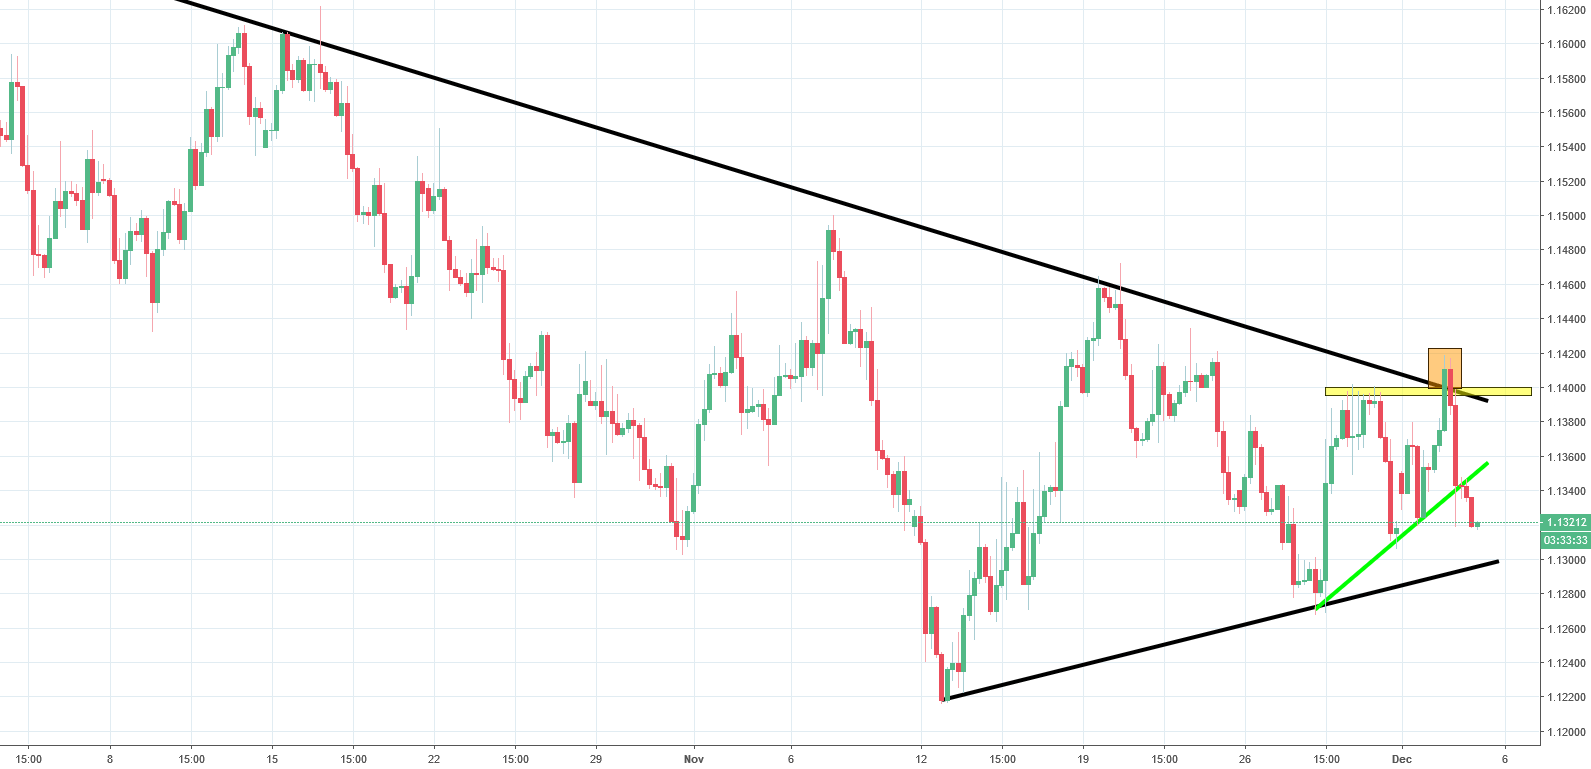
This one goes for the loss. The price did not decline much. Instead, we got an upswing. Yesterday, bullish momentum, allowed the price to break the upper line of the symmetric triangle pattern. In addition to this, the price broke the yellow horizontal resistance. The breakout was not long and the price reversed pretty fast. That created a false breakout pattern (orange). This kind of a formation is a strong signal to go short and that is what is happening now.
Bearish momentum is even more significant after the EURUSD broke the green dynamic support. With all this. The lower line of the symmetric triangle should be reached pretty soon.


Comments (0 comment(s))