EURUSD Analysis – iH&S or not iH&S? That’s the question
We will end Friday with the analysis of the EURUSD, which was previously mentioned here on the 16th of November. Back in that day, we were fresh after the comeback above the 1.13, which could have been perceived as a positive sign. We were not convinced though. This is how we concluded the previous analysis:
“This is still just a correction though. First of all, we are inside of the flag (blue). We are also below the down trendline (red) and the 38,2% Fibonacci. The sell signal is ON, as long as we stay below the blue resistance.“
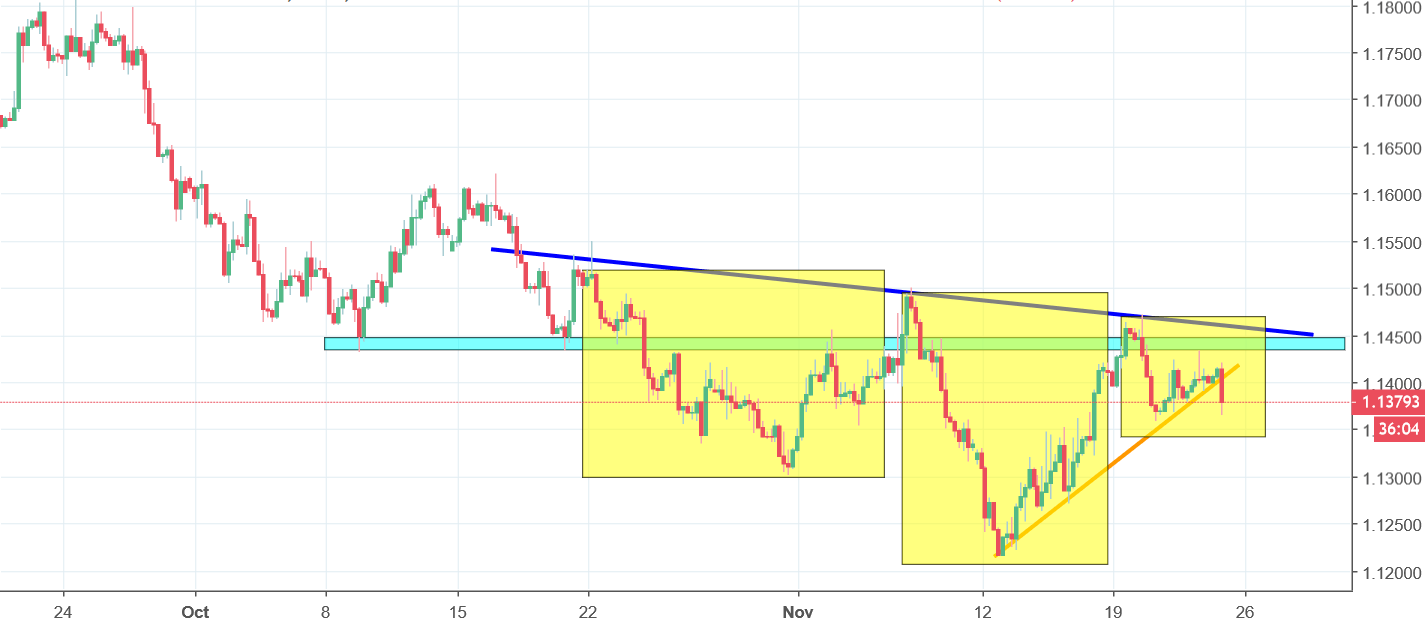
The price canceled this flag and went higher. The thing is that we did not manage to break the blue resistance, so the sell signal was not canceled. The price is currently creating the inverse head and shoulders pattern (yellow). That is positive but there is only one problem here. Actually two. The first one is that we are still below the neckline (blue, dynamic, so the buy signal is not here) and the second one is that the price is currently breaking the orange short-term up trendline, which is connecting the bottom of the head and the right shoulder. In theory that can cancel the positive sentiment and can start a new bearish wave. I think that definite answer should come at the end of the day. Price closing below the orange line – sell signal. Price closing above the neckline – buy.


Comments (0 comment(s))