GBPUSD Analysis – Breakout from the triangle will show us the direction

Another instrument for Monday is the GBPUSD. Two weeks ago, we also mentioned the Cable at the beginning of the week and we have to admit that it was a great call. Before we will deal with the current situation, let me show You, what we wrote in our previous piece about this instrument:
“Monday starts with a small pull-back but as long as we stay above the yellow horizontal support, the sentiment is positive and we should see the further rise. „
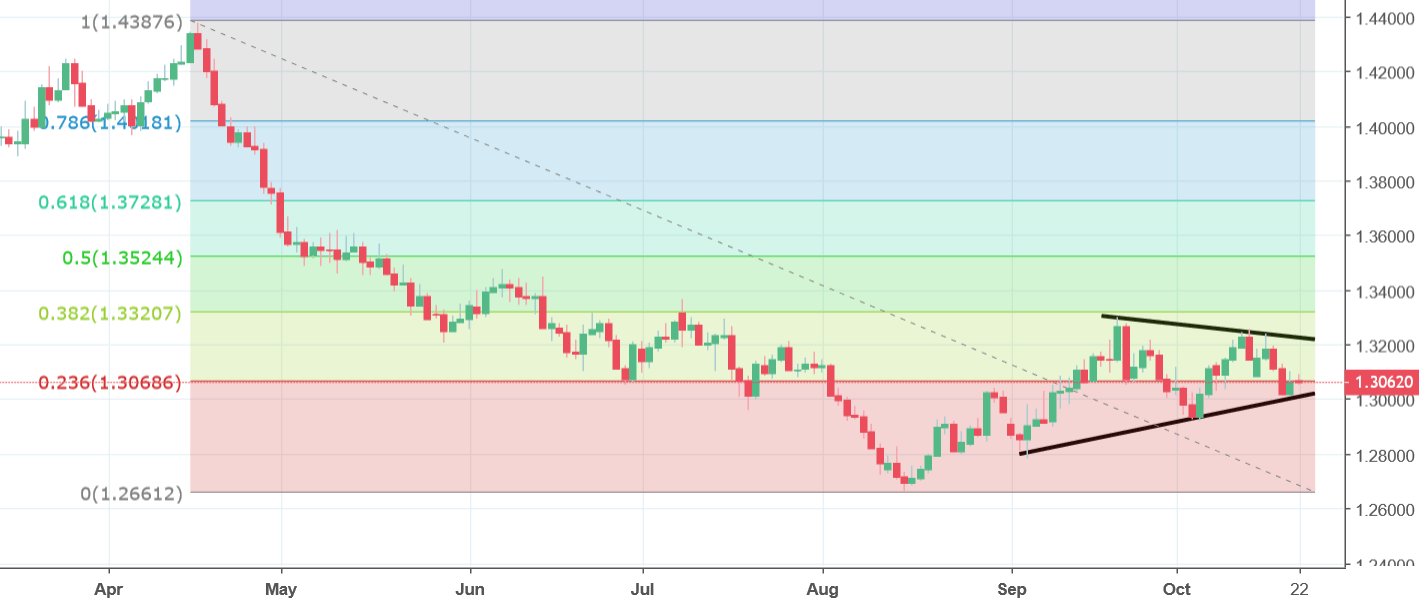
After that piece was published on our portal, GBPUSD was going significantly higher, reaching monthly highs on the Thursday, 11th of October. Time for a small update here. Cable is in the symmetric triangle pattern (black) after bouncing from the 38,2% resistance in September. This kind of a formation, below such an important resistance, indicates the willingness for a further slide Our sentiment at the moment is rather negative and we see chances for a further drop. The sell signal will be triggered, when the price will break the lower line of this pattern, which currently is very likely to happen.


Comments (0 comment(s))