GBPUSD Analysis – Broken support tested as a resistance

Time for an update on the GBPUSD! We mentioned this instrument two days ago, when the price was one small step from a strong sell signal. Let’s see how that worked out for us, shall we? Before we will jump into the current situation, a small recap of what we wrote in our previous piece about this instrument:
“Our sentiment at the moment is rather negative and we see chances for a further drop. The sell signal will be triggered, when the price will break the lower line of this pattern, which currently is very likely to happen. „
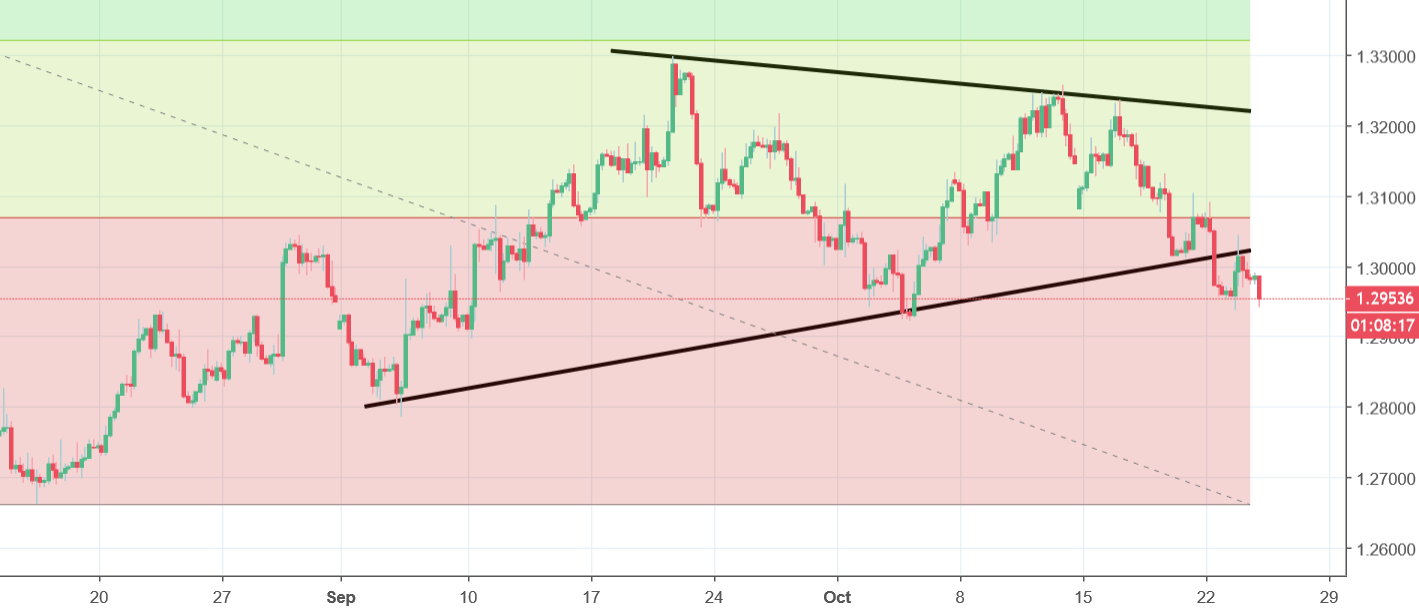
Indeed, the price broke the lower line of the triangle opening the way towards the new lows. What is super interesting and in the same time, very technical, after the breakout, we got a typical bullish pull-back, which tested the broken support as a closest resistance. The test was positive for the sellers as the price bounced from that line and went lower. In other words: on Monday we got a sell signal and yesterday we got a confirmation. The sentiment is negative and in the next few weeks we should get to the the lows from the 15th of August.


Comments (0 comment(s))