GBPUSD Analysis – test of the lower line of the triangle

Long time, no see with the Cable. Well, during Brexit negotiations I preferred to avoid trading this instrument. Situation changes today as we do have a very nice technical movement and the volatility caused by fundamentals should decrease now, as we are all waiting for the voting in UK’s parliament. Previously, we talked about the GBPUSD on the 24th of October and we said this:
“The test was positive for the sellers as the price bounced from that line and went lower. In other words: on Monday we got a sell signal and yesterday we got a confirmation. The sentiment is negative and in the next few weeks we should get to the the lows from the 15th of August. „
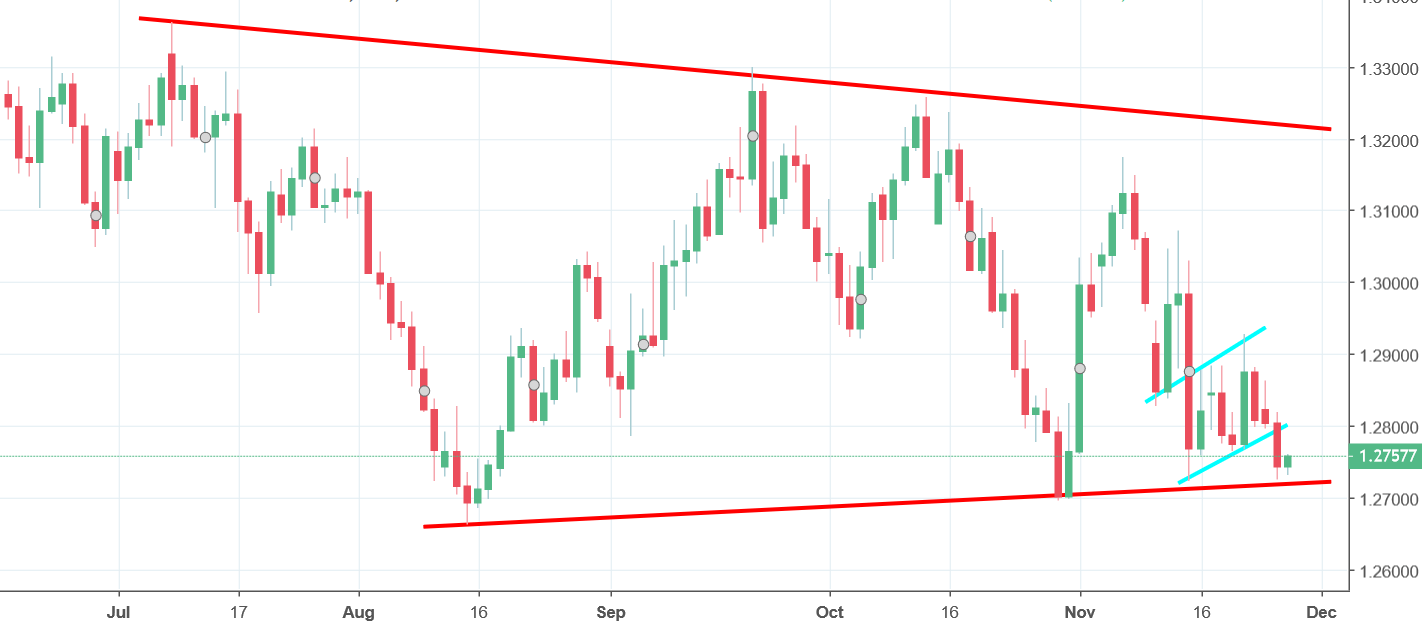
The price indeed went lower and aimed for that target. Then we bounced, went higher and most recently, aimed for those lows again. That price swings allowed the Cable to create a big symmetric triangle pattern (red lines). The reason why we write about this pair today is that yesterday, we reached the lower line of the triangle again. Today, we do have a small bounce, which actually is the trading occasion. The way how one can trade it is to buy hoping for a bullish correction with a stop loss around 1.27 or to sell once the lows from yesterday will be broken. In the second case, we are talking about potentially huge profits here as that can be a start of a new bearish wave.


Comments (0 comment(s))