Markets after the FOMC – Gold, FTSE and EURGBP

FOMC decision about the interest rate in US is a history now. That was a great event for the market participants. Brought us increased volatility, higher momentum and few interesting trading opportunities. Some of them were in line with the signals from the technical analysis and some of them were against. Today I will show you one example from the most popular types of assets. One index, commodity and a currency pair.
First, we will start with the currency pair. Maybe you were expecting this, we will analyse EURGBP. Why? Cause we did that previously on the 16th of March and our view on that instrument was extremely bearish. EURGBP was trading around the 0.882 and back in that day, we wrote:
“Currently, the sentiment is 100% negative. It is hard to estimate the potential target for this movement but 0.87 (orange) seems quite reasonable. The potential risk to reward ratio for this trade is still very tempting. „
Where we are now?
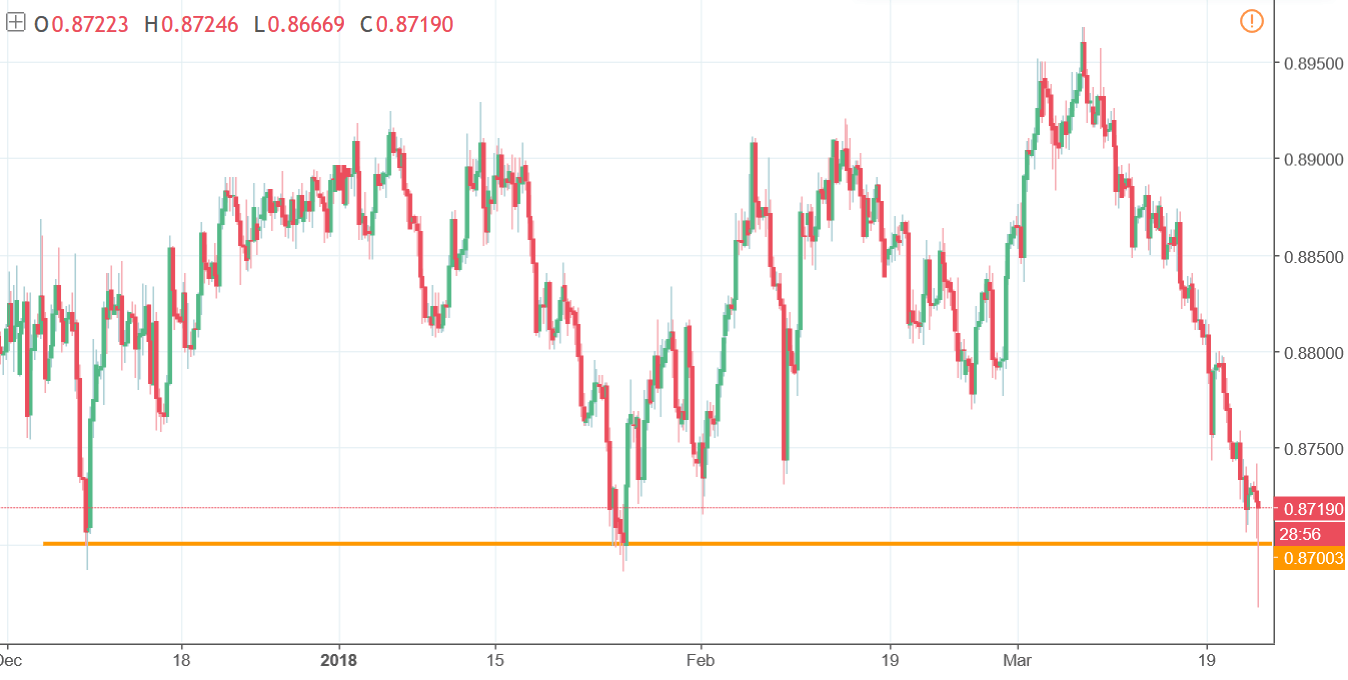
0.87 was tested today (orange). The price attacked this level violently and in the same way bounced from it. The target, mentioned by us in the previous analysis, has been reached and so far, plays a role of a strong support. It is almost certain that many traders used this area for taking profits from this huge downswing. That changes a bit the current sentiment on this pair. Current short term outlook is positive. As long as we stay above the 0.87, we do have higher chances for further rises. This positive scenario will be denied, once the price will break this level.
If we are already in Europe and we are talking about the British currency, let’s move to the British index – FTSE100. Fed’s decision and problems in America (with Facebook for example), negatively influenced this instrument. The timing was terrible for London bulls – FTSE was on the edge, balancing over the thin line on the 7100 points support (black). That negative external influence was enough to cause a breakout. Technically, the price closing below the 7100 points is end of the game for the demand. It is not even end of the first half, they are completely out. 7100 was super important in the recent months and from the technical point of view, breakout here creates an ultra strong bearish signal.
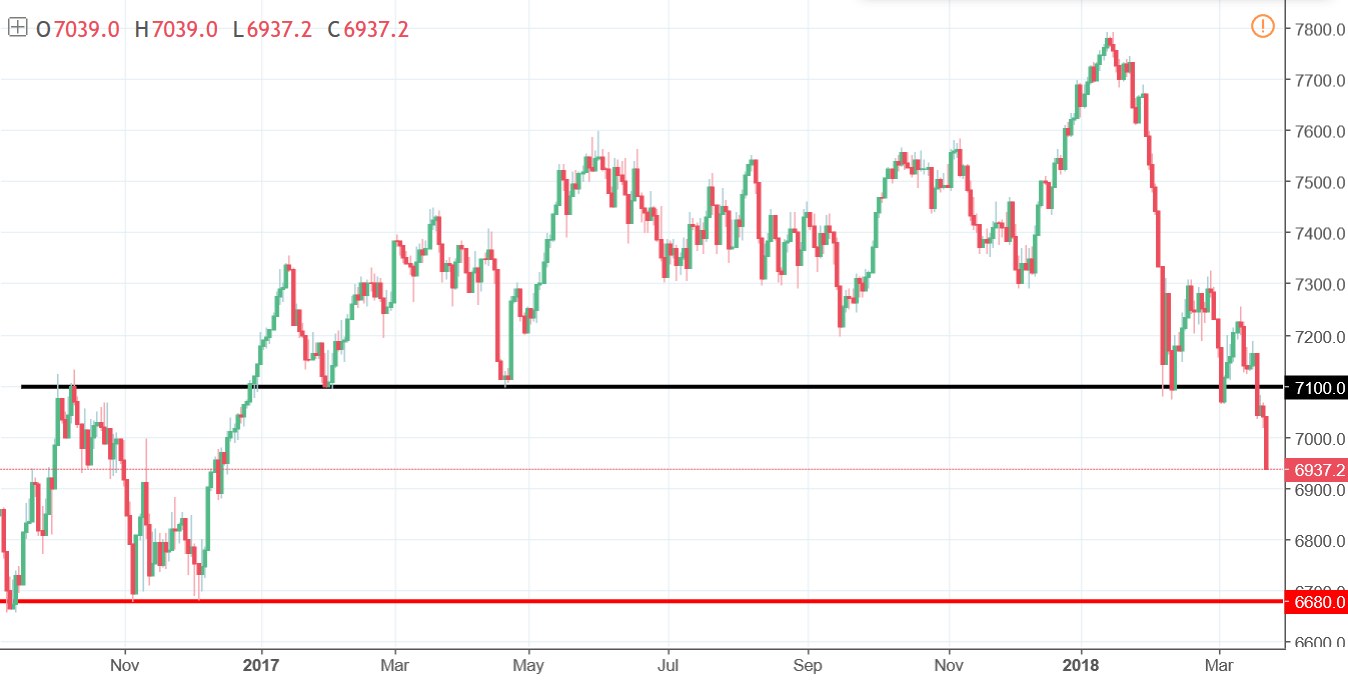
The only hope for the buyers right now is the false breakout. Is it possible? Yes, happens often on many instruments. Is it probable? Not so much And as long as trading will be a game of probabilities, the sentiment stays negative. Oh, by the way, 6680 (red) is the target right now.
We had FX, we had index, now time for a commodity. Here we chose the most popular one – Gold. Popularity was not the reason though. Ahead of the FOMC Gold was having a very good, technical, buy signal. That one was later strengthened by the FOMC, so fundamentals and technicals pointed in one direction. Once you see that kind of a situation on the market – you trade it.
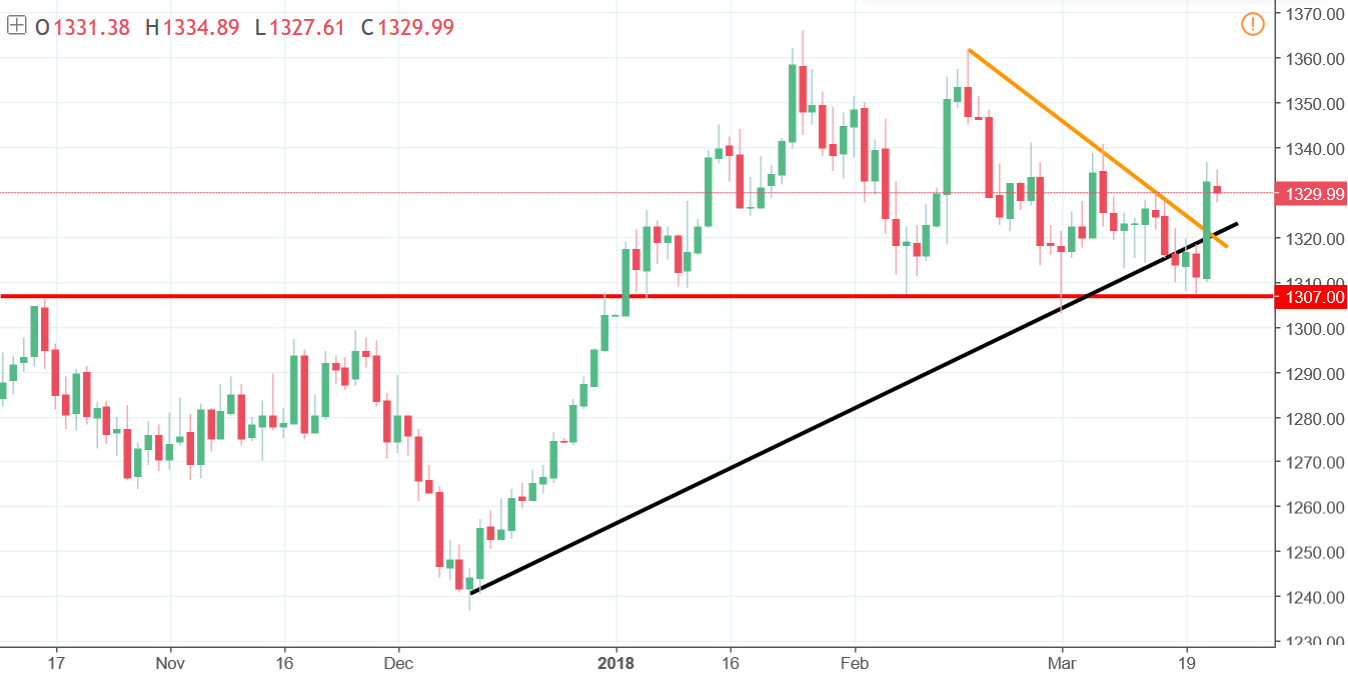
Technically, ahead of the FOMC, the price bounced from the crucial support around the 1307 USD/oz. FED added momentum here, which allowed to come back above the long-term up trendline (black) and brake the mid-term down trendline (orange). That should sort out the sentiment for the next few weeks – buyers should control the situation and keep price on the high levels.


Comments (0 comment(s))