NZDUSD Analysis – Head and Shoulders !

Dust after the FOMC slowly settles. Movements on the USD and the stocks allowed to create many trading signals. One of the examples is the NZDUSD. Before we will tell you about the current situation, we need to deal with our previous piece about this instrument. The last time, we wrote about this pair on the 28th of November and back in that day, we were bullish:
„Our positive outlook will be denied, when the price will drop below the 0.675 (lows of the flag), which as for now, seems less likely to happen. „
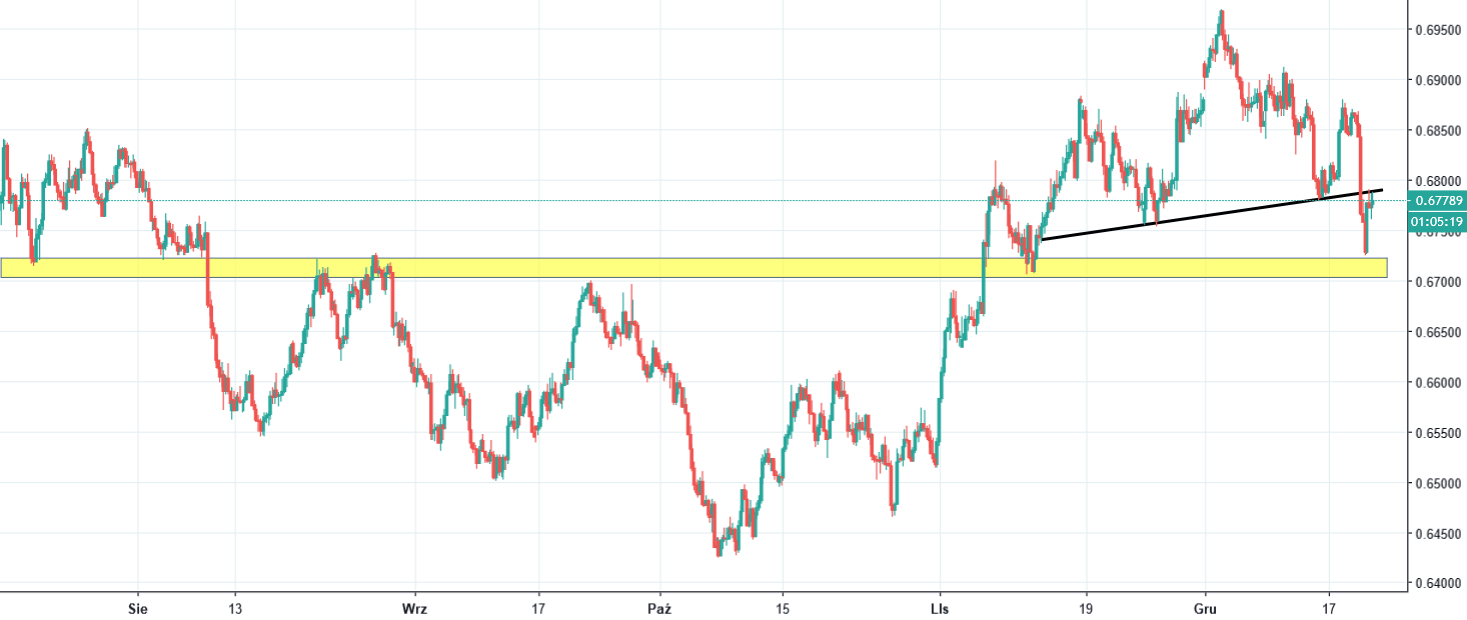
That was a great mid-term call as the price went higher and on the 4th of December, made new local highs. That was it though, the price started to decline and created a head and shoulders pattern. Movement caused by the FOMC broke the neckline of this formation (black), which technically brought us a sell signal. Today, we do have a small bullish bounce but it can be considered as a typical price action movement of the price testing the neckline from the bottom. As long as we stay below the neckline, the sentiment is negative and NZDUSD should continue to decline.


Comments (0 comment(s))