Will the Japanese Yen break the 113.00 level? USD/JPY Technical Analysis
The USD/JPY pair keeps on delighting traders with its predictability. Earlier it was assumed that the first wave of the emerging downward impulse is formed and in the near future, we will expect corrective growth.
At the moment, we see that the price has started to grow, but it’s very difficult to say how long this phase of the market will last, as the price can simply go to the flat market and stay a couple or more days in it.
In such a situation, it is recommended to be patient and wait for the resumption of the pair’s decline. Thus, it is not necessary to jump to conclusions as well as trying to trade in one direction or another. At the moment, it is better to be out of the market and watch the developments.
The US Dollar declined heavily from the 113.70 resistance area against the Japanese Yen. The USD/JPY pair traded below the 113.00 and 112.80 support levels to enter a bearish zone.
The decline was such that the pair even broke the 112.50 level and the 50 hourly simple moving average. A low was formed at 112.30 and later the pair started an upside correction.
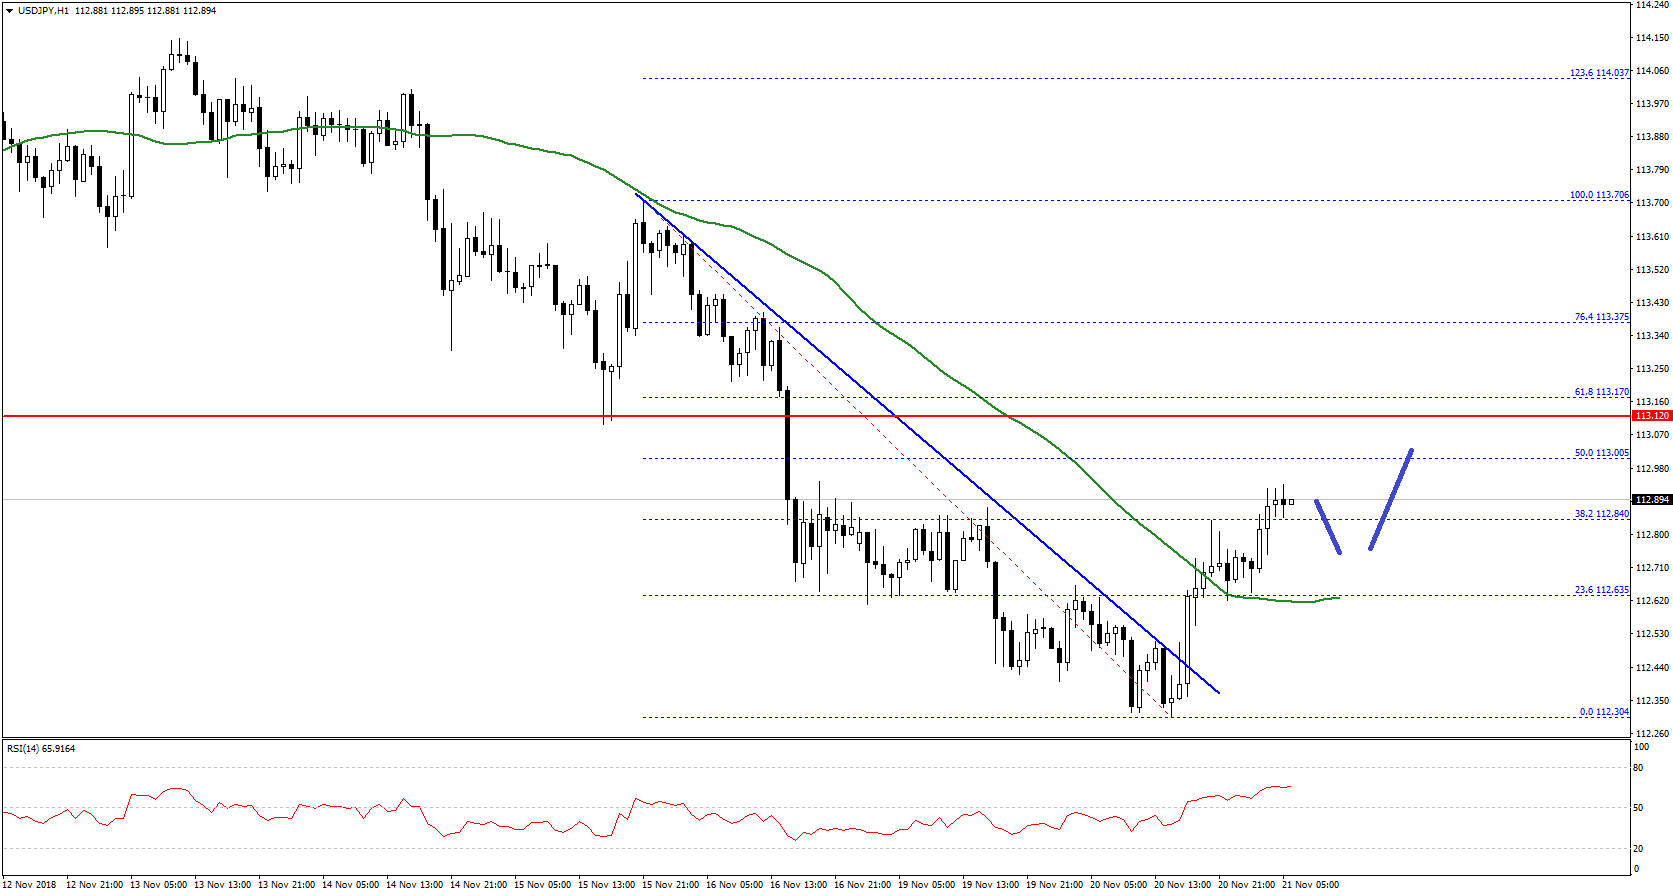
It climbed above the 112.50 level, the 50 hourly SMA and the 23.6% Fib retracement level of the recent decline from the 113.70 high to 112.30 low. Moreover, there was a break above a bearish trend line with resistance at 112.45 on the hourly chart.
Therefore, it seems like the pair moved into a positive zone above 112.80 and it could continue to recover towards the 113.00 and 113.20 levels in the near term.


Comments (0 comment(s))