USDCAD Analysis – Bounce from the yearly highs?

Time to deal with the currencies. We start the USDCAD, where yesterday, the price made new mid-term highs but the buyers should be very careful, when thinking about going long. Previously, we analyzed this instrument on Monday and we were rather bearish. So does it mean that we were wrong? No, because we said that traders should wait with the short positions. Take a look yourself:
“What we see here is the head and shoulders pattern (blue) and the price putting pressure on the neckline and the mid-term up trendline. Once those will be broken, we will receive a strong sell signal. The only hope for the buyers can be the yellow horizontal support so if you want to play it safe, before going short, wait for the breakout of the that one too. „
So the outcome of this was that the neckline and the up trendline did not get broken. The price bounced from those and instead of the Head and Shoulder pattern, we eventually received a triple top formation and again, without a signal. As for now.
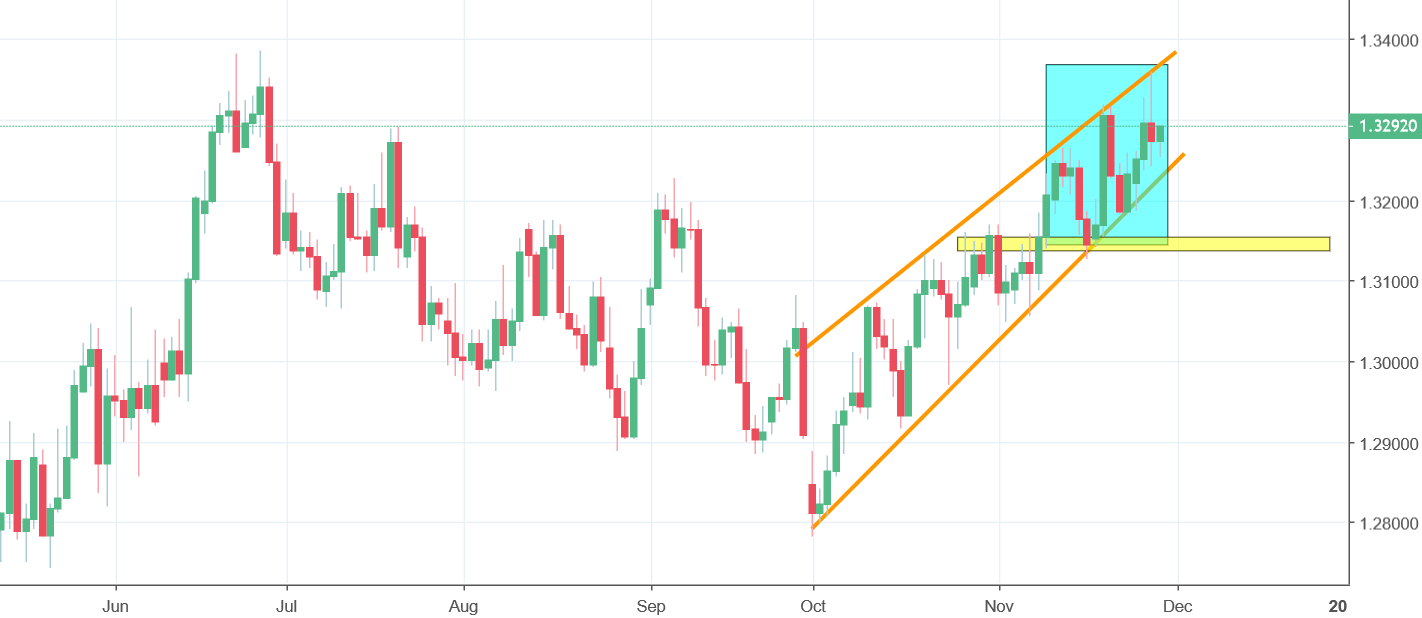
Buyers can feel good as the price is inside of the channel up formation. That calm can be just an illusion though. Look at the daily chart. Yesterdays candle is a pin bar, bouncing from the resistance created by yearly highs. That can turn ugly but once again, for the sell signal, we need to see the breakout of the lower line of the channel up formation first. As long as we stay above, the sell signal is just a retail traders’ dream (as they love to go against the trend).


Comments (0 comment(s))