USDCAD Analysis – from the iH&S to the H&S

Second instrument today comes from the forex market and was analyzed here on the 18th of October. In that previous piece, we saw a chance for a further upswing. We pointed at a very important resistance and said that once it will be broken, we will receive a strong buy signal:
“Now, USDCAD stands in front of the combination of the two important resistances. The first one is the upper line of the flag (red) and the second one is the neckline (blue). Price closing a day above those two will be a proper buy signal and chances for that are quite high. “
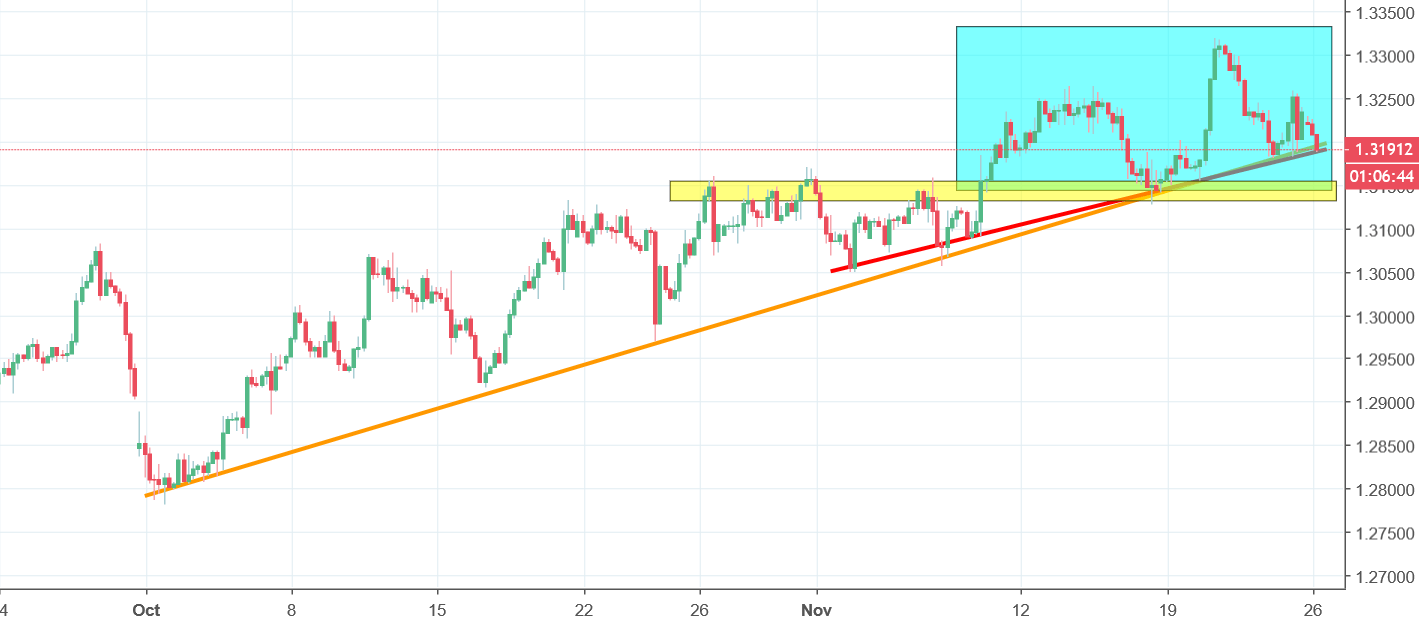
That one worked out pretty well. USDCAD broke the resistance almost immediately giving us a proper buy signal. The rise lasted for slightly more than a month – till the 21st of November. That is the day, when the price made local highs… Does that mean that from this point we should experience a bearish reversal? Not really, but chances for that are growing. What we see here is the head and shoulders pattern (blue) and the price putting pressure on the neckline and the mid-term up trendline. Once those will be broken, we will receive a strong sell signal. The only hope for the buyers can be the yellow horizontal support so if you want to play it safe, before going short, wait for the breakout of the that one too.


Comments (0 comment(s))