USDCAD Analysis – Long-term sell signal

Time for the Forex market. We start with the analysis of the USDCAD and this one will be a long-term one, so for traders who like to hold their positions for few weeks. Before we will dig any deeper, let me show You first our previous analysis about this instrument. It was written on the 18th of September and back in that day we were bearish:
“Price closing a day below the last one, will be a proper signal to go short, with the lows from the August being the closest target. Chances for that are very high. Sell signal will be denied, when the price will come back above the green horizontal resistance. „
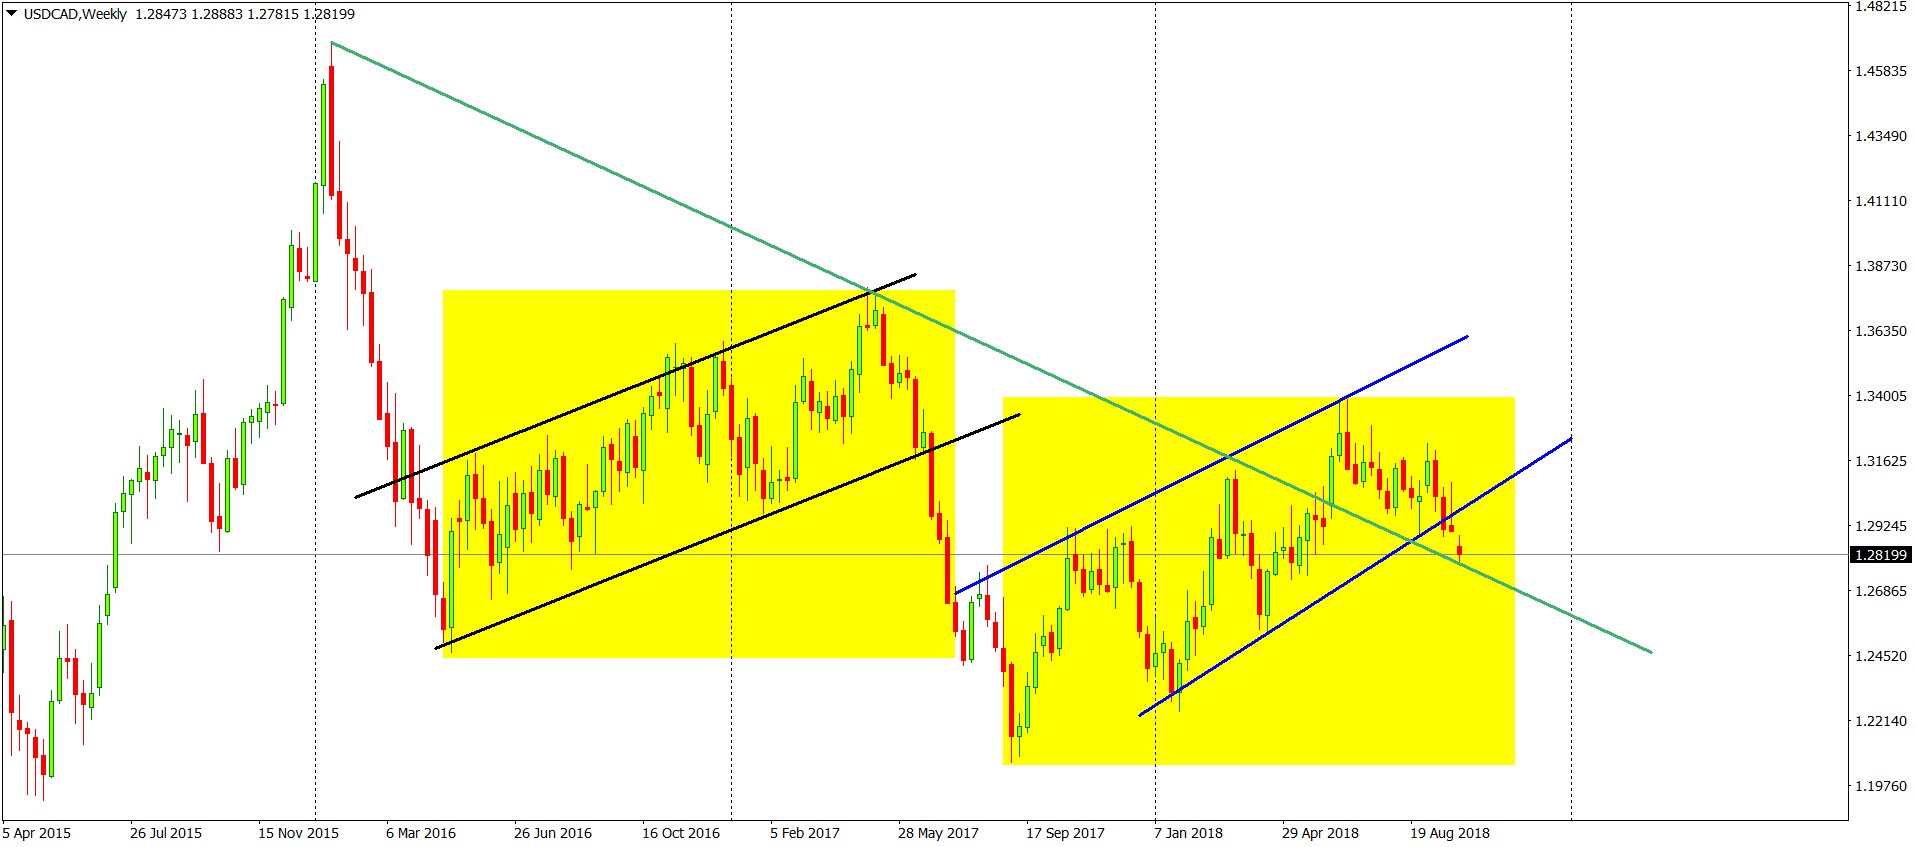
When those words were written, we were on 1.299. Now, exactly two weeks later, we are 170 pips lower. How about that for a good trading signal? OK, but what is the situation now? Well, it is negative, the price broke the lower line of the giant flag formation (blue). This is the second one in a row, additionally strengthened by the correction equality pattern (yellow). That breakout sorts out everything. We do have a legitimate sell signal and by the end of the 2018, we should see new yearly lows.


Comments (0 comment(s))