USDCHF Analysis – Double top formation
Last analysis is the USDCHF, where we can see a strong decline. In our last piece about this instrument, we were negative and we saw a great chance for a drop. We were right with that but the thing is that the timing was not right. Straight after our bearish analysis was posted, the price went higher, made the second top and then reversed. Well, sometimes it happens like that. For the record, this is how we concluded the last piece:
“According to the price action rules, we should see a further decline, especially that the price broke the black up trendline. Worth mentioning is the fact that the USDCHF created a head and shoulders pattern on the H1 chart, which additionally promotes the decline. As long as we stay below the blue area, our outlook is negative. “
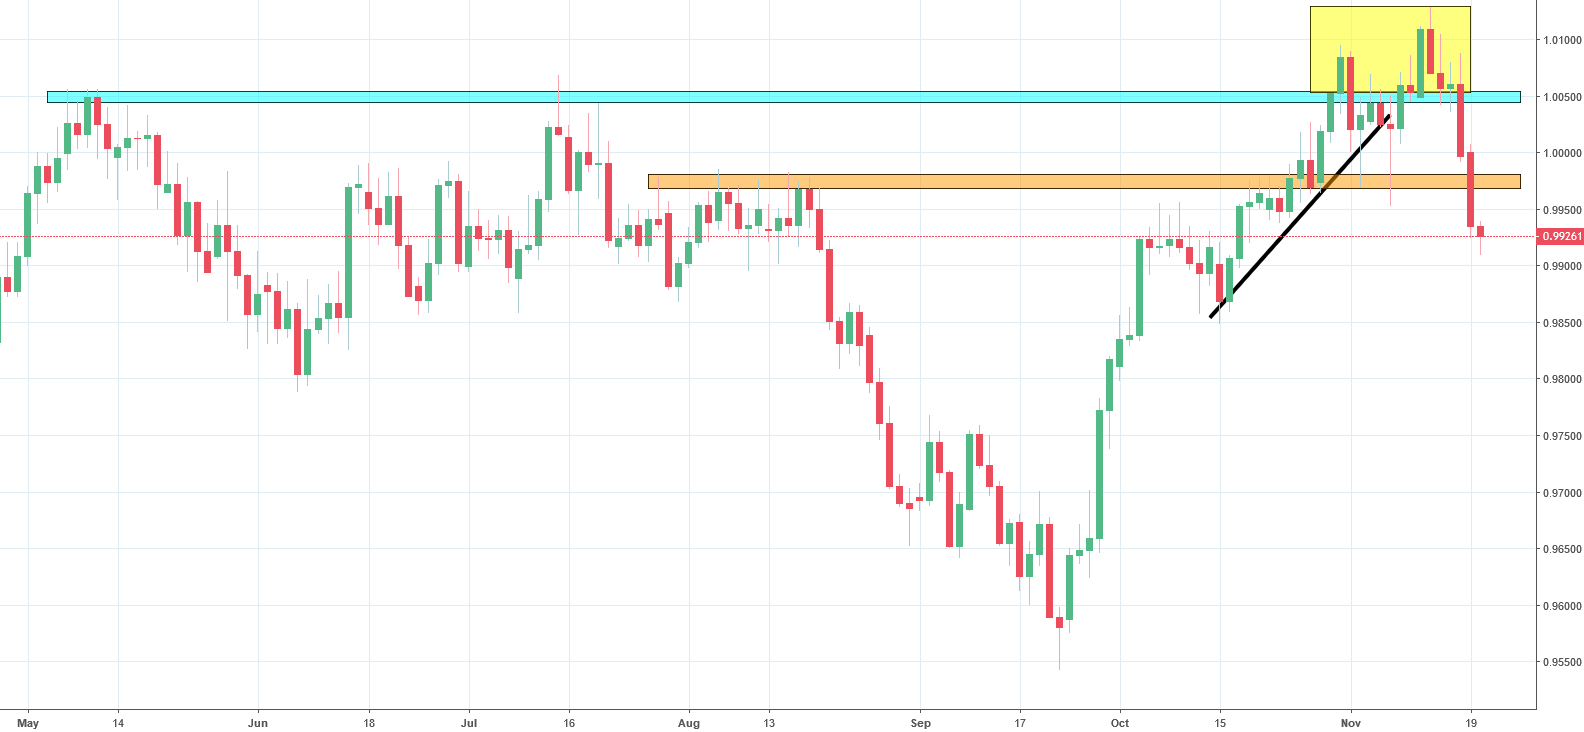
As we said at the very beginning, the timing was wrong. Today we are lower and we do have high chances for the further drop. The decline is promoted by the fact that we do have the double top formation (yellow rectangle), which in the same time is a false breakout pattern above the blue area. In addition to this, USDCHF broke the orange horizontal support. Current sentiment is negative and the price should eventually reach the lows from the end of September.


Comments (0 comment(s))