USDCHF Analysis – False breakout

Last technical piece of the day, is about the USDCHF, which was previously mentioned here on the 26th of October. Back in that day, we were bullish and we were anticipating a rise above the psychological barrier of the parity (1). This is what we wrote in our last analysis:
“That is a buy signal and a confirmation in the same time. The positive sentiment is here and I am certain that soon we will see 1 in front here. „
That was a good call but only for the short/mid-term traders. The price was going up only till the last day of the month. The first day of November brought us a reversal but the upswing anticipated by us gave buyers almost 100 pips. Well, better than nothing…
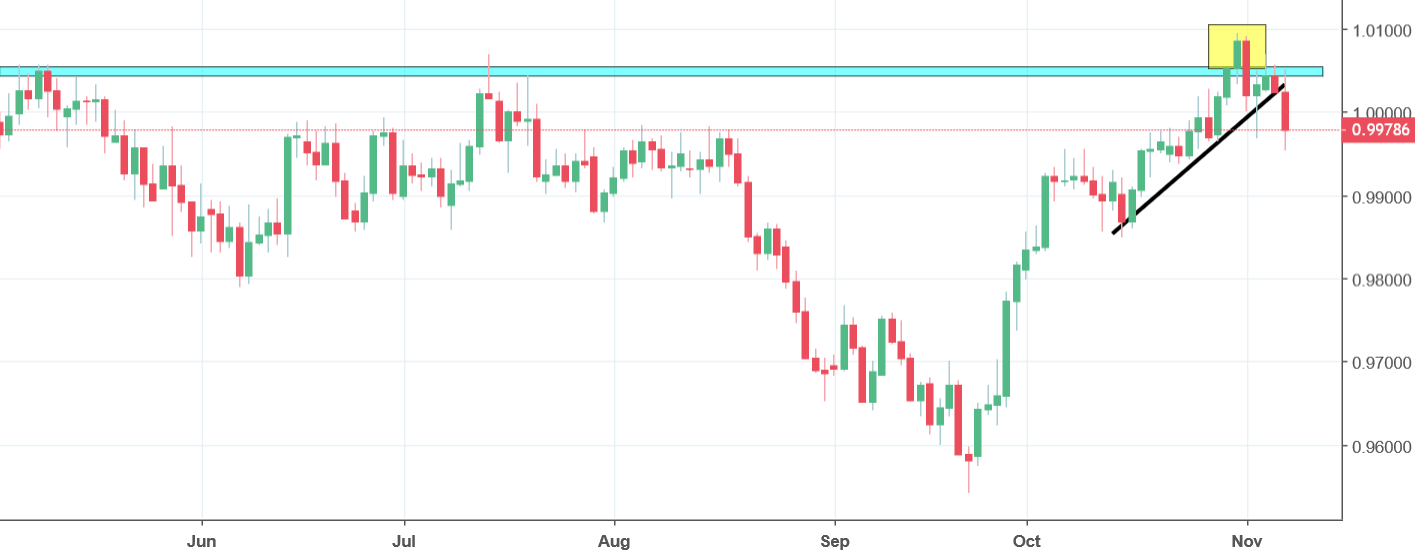
Our current view is different. The price came back below the blue horizontal support, which makes the recent breakout (yellow) a false one. According to the price action rules, we should see a further decline, especially that the price broke the black up trendline. Worth mentioning is the fact that the USDCHF created a head and shoulders pattern on the H1 chart, which additionally promotes the decline. As long as we stay below the blue area, our outlook is negative.


Comments (0 comment(s))