USDCHF Analysis – Flag is a history now

In this piece, we will deal with the USDCHF, where yesterday we witnessed a huge drop. In our last piece, from the 20th of November, we were negative, expecting a further slide. We keep those expectation intact, the only thing is, that in the meantime we had a small bullish correction. Before we will get deeper into that, let me show You the bit from our previous analysis first:
„The decline is promoted by the fact that we do have the double top formation (yellow rectangle), which in the same time is a false breakout pattern above the blue area. In addition to this, USDCHF broke the orange horizontal support. Current sentiment is negative and the price should eventually reach the lows from the end of September. „
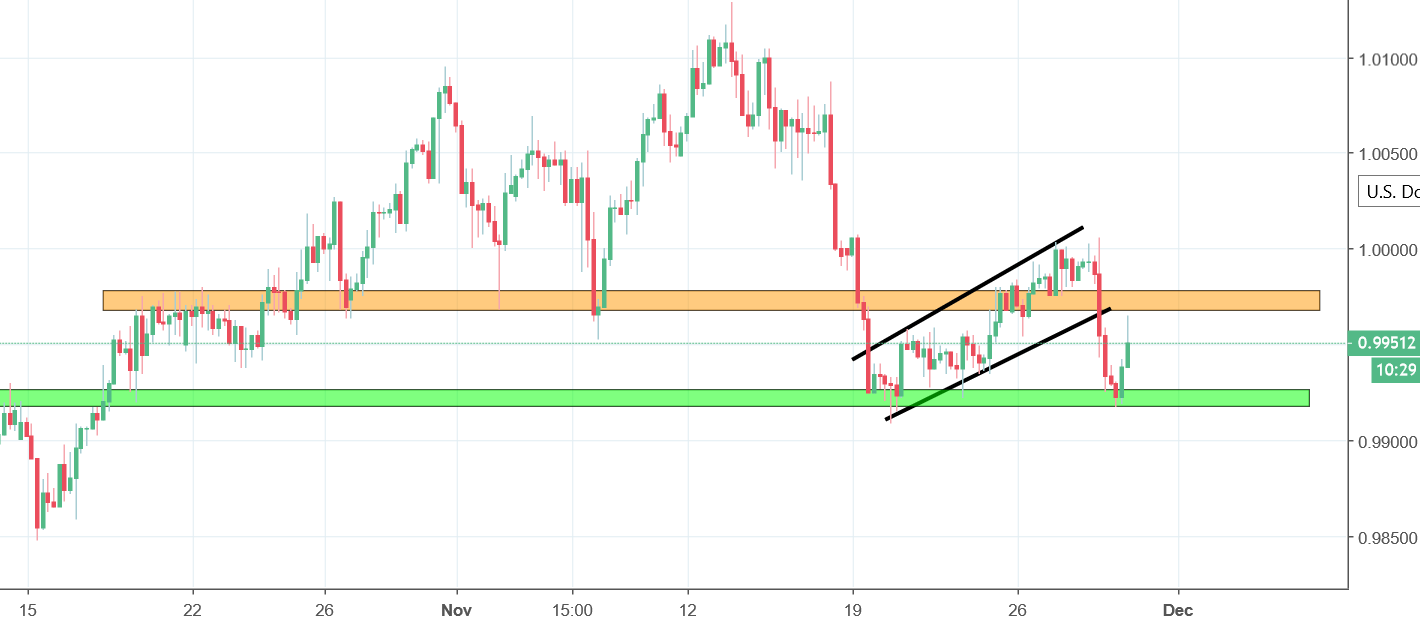
So yes, the correction started almost immediately after those words were written. The price created a flag pattern (black lines) and went higher. The flag reached a parity and since that, the USDCHF reversed. Obviously Jerome Powell helped here a little but you can see that the drop was expected much earlier. If you still are not convinced to go short, check out the green horizontal resistance. That is the place where the flag started and where the drop from yesterday stopped. As long as we are above you can be suspicious about the further decline but price breaking that support will be a clear sign opening us a way towards new mid-term lows.


Comments (0 comment(s))