USDCHF Analysis – Inside a rectangle
Second piece in the technical part is the USDCHF, which for the last time, was mentioned here on the 29th of November. We need to update you now about the situation here as it is getting very interesting. This is what we wrote in our previous piece:
“If you still are not convinced to go short, check out the green horizontal resistance. That is the place where the flag started and where the drop from yesterday stopped. As long as we are above you can be suspicious about the further decline but price breaking that support will be a clear sign opening us a way towards new mid-term lows. „
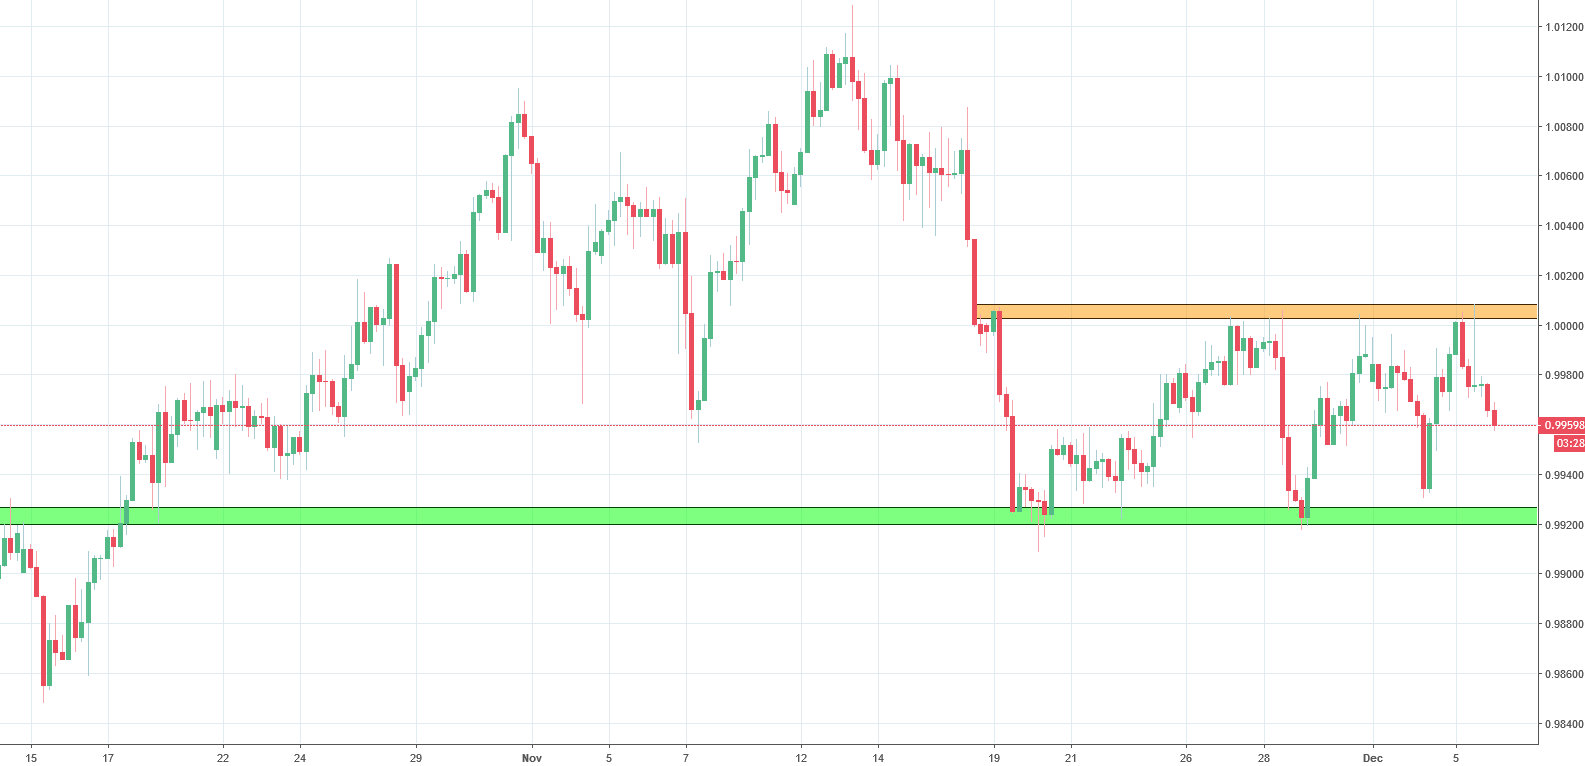
So yes, we warned that going short back then could be a bit premature. The green support was defended and the price climbed higher, then dropped, then went higher again and dropped again. This roller coaster allowed to create a rectangle formation (orange and green). The latest bounce from the resistance happened with a bearish engulfing and the shooting star candlestick patterns. That kind of a price action is usually a reliable sell signal. I think that the most probable scenario here is the further decline.


Comments (0 comment(s))