IOTA Analysis – Decline towards the 0.95 USD

The second altcoin of the day will be IOTA. The last time we analysed this instrument on the 9th of May and the price was giving us few bullish signals:
“Current situation is also positive. IOTA broke the horizontal resistance on the 2,2 USD (green) and later used that as a support. In addition to that, we can see that the coin is using the mid-term up trendline (pink), which only strengthens the buy signal. On top of that, look at the candle from Monday, it is a very powerful hammer, which shows the bullish counter attack and a demand on lower levels. As long as we stay above the green area, the sentiment is definitely positive. “
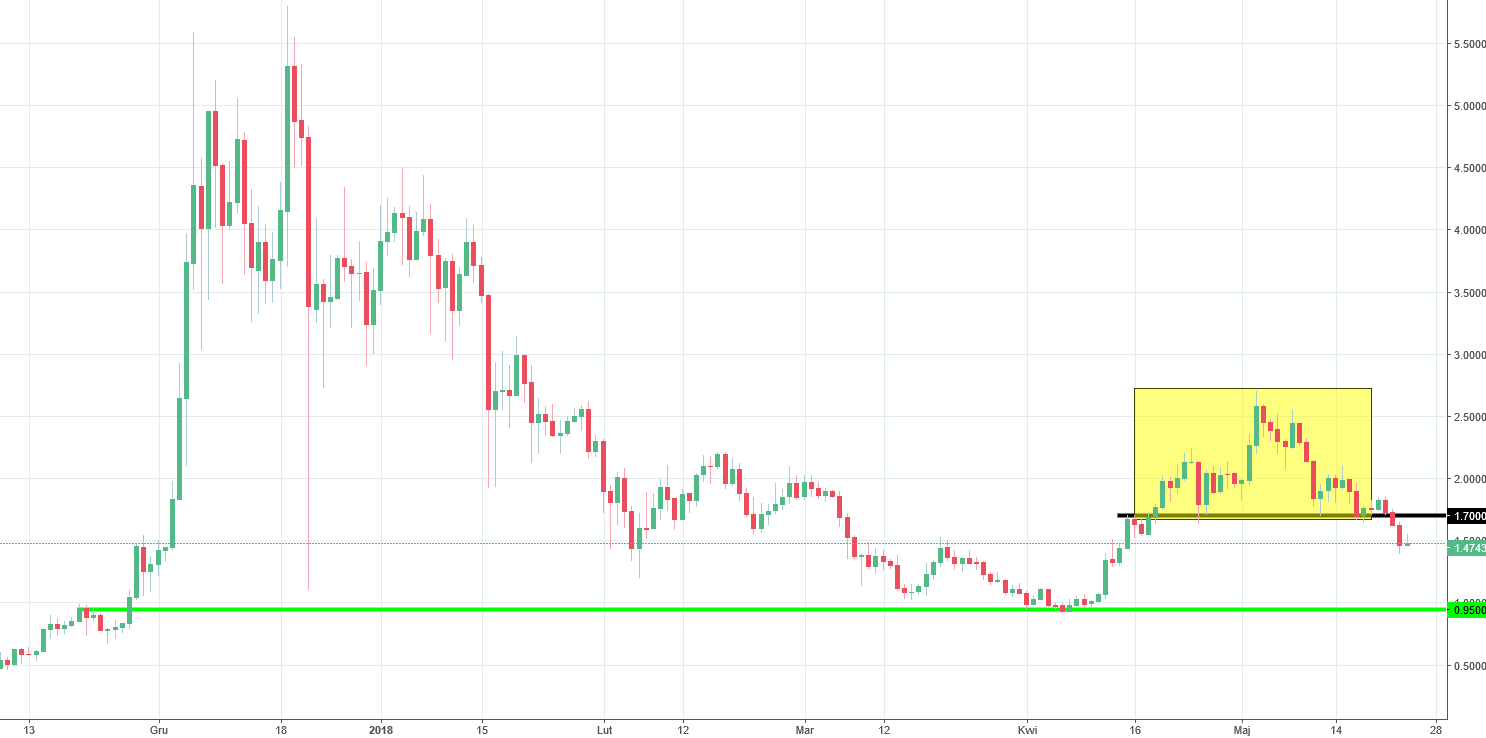
That is what we wrote in our last piece and you have to admit that the price action was quite convincing. Well, the market decided to do the opposite. The hammer that we mentioned was eventually ignored and the price went lower. Here, we also created the head and shoulders pattern (yellow), like on the BitShares, already analysed by us today. The neckline of this formation (black) got broken yesterday, which triggers us a legitimate sell signal.
Target for this downswing is on the 0.95, which was an important support in April. Chances that we will get there are high and this selling occasion looks sweet.


Comments (0 comment(s))